Talking Tech: Analyzing Feature Importance in Neural Networks
Probably the biggest issue I come across working with artificial neural networks is that they are a bit of a black box.

Important Note: If you haven't, please check out my previous post on building artificial neural networks before diving into this article. This post largely builds off of that previous post and can almost be seen as an addendum to the former.
Probably the biggest issue I come across working with artificial neural networks is that they are a bit of a black box. What I mean by that is that you don't really have a lot of insight into a particular model's internal workings and calculations due to the very nature of how neural networks work. At least not in relative contrast to other types of machine learning such as random forests, gradient boosting, and the like. scikit-learn, which is the bread and butter library when it comes to building models, offers all sorts of functionality that give insight into these other types of models. For example, you can use it to evaluate decision trees and output analytics on which features are weighed most importantly.
There's really nothing out-of-the-box that can do this for neural networks. At least, there's nothing of which I am aware. This is problematic as I'll often have people ask me how a model weighs certain features. I don't know, it's a black box! At least, that is, until now. I've tracked down some code that, given a set of test data and a trained fastai model, will output and display feature weights. And I'm going to show you how to do that in this post!
Initial Setup
We have two prerequisites before we dive in. First, we need a trained neural network. Second, we need a set of data that can be fed into that neural network. If you already have a neural network trained using fastai as well as its corresponding training data, you can go ahead and skip this entire section. Ideally, you are reading this very soon after going through the previous post as we'll use the exact same model and dataset as before.
If it's been a while since you went through the previous post and you no longer have the data sets available, I am going to give you some code to recreate the dataset from the previous post. However, we won't be walking through it snippet-by-snippet again. Here's the code block, which has basically been copy-and-pasted from the previous article for your convenience. Make sure you fill in your personal CFBD API key on line 9.
import cfbd
import numpy as np
import pandas as pd

from fastai.tabular import *
from fastai.tabular.all import *

configuration = cfbd.Configuration()
configuration.api_key['Authorization'] = 'your_api_key'
configuration.api_key_prefix['Authorization'] = 'Bearer'

api_config = cfbd.ApiClient(configuration)

teams_api = cfbd.TeamsApi(api_config)
ratings_api = cfbd.RatingsApi(api_config)
games_api = cfbd.GamesApi(api_config)
stats_api = cfbd.StatsApi(api_config)
betting_api = cfbd.BettingApi(api_config)

games = []
lines = []

for year in range(2015, 2022):
    response = games_api.get_games(year=year)
    games = [*games, *response]

    response = betting_api.get_lines(year=year)
    lines = [*lines, *response]

games = [g for g in games if g.home_conference is not None and g.away_conference is not None and g.home_points is not None and g.away_points is not None]
games = [
    dict(
        id = g.id,
        year = g.season,
        week = g.week,
        neutral_site = g.neutral_site,
        home_team = g.home_team,
        home_conference = g.home_conference,
        home_points = g.home_points,
        home_elo = g.home_pregame_elo,
        away_team = g.away_team,
        away_conference = g.away_conference,
        away_points = g.away_points,
        away_elo = g.away_pregame_elo
    ) for g in games]

for game in games:
    game_lines = [l for l in lines if l.id == game['id']]

    if len(game_lines) > 0:
        game_line = [l for l in game_lines[0].lines if l['provider'] == 'consensus']

        if len(game_line) > 0 and game_line[0]['spread'] is not None:
            game['spread'] = float(game_line[0]['spread'])

games = [g for g in games if 'spread' in g and g['spread'] is not None]
for game in games:
    game['margin'] = game['away_points'] - game['home_points']

df = pd.DataFrame.from_records(games).dropna()
After running that, you should have a pandas data frame loaded up. Next, we need to load up a trained neural network. Hopefully, you exported the network from the previous walkthrough. If not, you'll have to go through those steps again to train one up. In this instance, I exported my neural from the previous article as talking_tech_neural_net. I can load that back up with the following code:
learn = load_learner('talking_tech_neural_net')
Now we're ready to proceed to feature analysis.
Analyzing Features
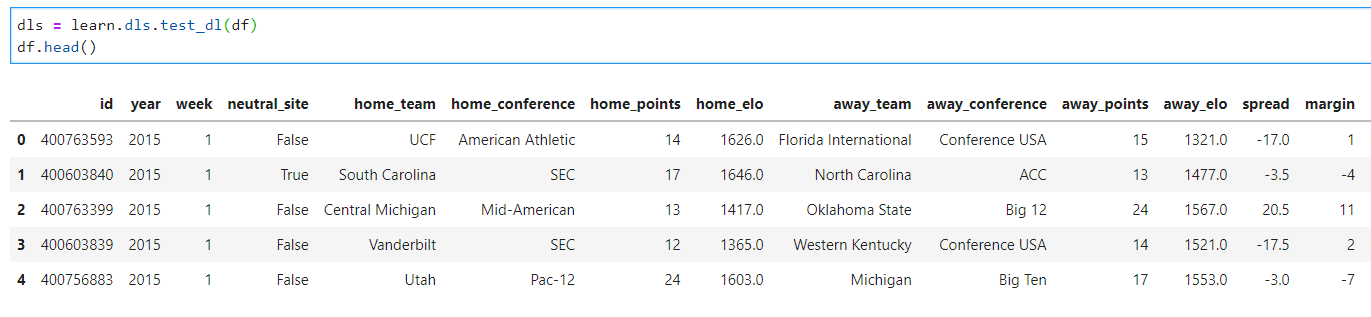
You should have a trained neural network and a corresponding dataset in a data frame. If you haven't already, let's make sure the data frame is loaded into the neural network. Here, my data frame is named df .
dls = learn.dls.test_dl(df)
df.head()
Next, we need to import and configure matplotlib. This will allow us to visualize the feature weightings.
import matplotlib.pyplot as plt

# This is the styling I use. Check out other themes here: https://matplotlib.org/3.2.1/gallery/style_sheets/style_sheets_reference.html
plt.style.use('fivethirtyeight')

# Graph sizing
plt.rcParams["figure.figsize"] = [20,10]
Now it's time to add the code that analyzes the neural network. I'm not going to walk though this line-by-line. This is code that I found here and modified to ensure that it works. Basically, this creates a class called PermutationImportance that runs the data through the neural network and analyzes how changes in each of the different features impact the final value that the neural network outputs. Go ahead and paste and run this code.
class PermutationImportance():
  def __init__(self, learn:Learner, df=None, bs=None):
    "Initialize with a test dataframe, a learner, and a metric"
    self.learn = learn
    self.df = df
    bs = bs if bs is not None else learn.dls.bs
    if self.df is not None:
      self.dl = learn.dls.test_dl(self.df, bs=bs)
    else:
      self.dl = learn.dls[1]
    self.x_names = learn.dls.x_names.filter(lambda x: '_na' not in x)
    self.na = learn.dls.x_names.filter(lambda x: '_na' in x)
    self.y = learn.dls.y_names
    self.results = self.calc_feat_importance()
    self.plot_importance(self.ord_dic_to_df(self.results))

  def measure_col(self, name:str):
    "Measures change after column shuffle"
    col = [name]
    if f'{name}_na' in self.na: col.append(name)
    orig = self.dl.items[col].values
    perm = np.random.permutation(len(orig))
    self.dl.items[col] = self.dl.items[col].values[perm]
    metric = learn.validate(dl=self.dl)[1]
    self.dl.items[col] = orig
    return metric

  def calc_feat_importance(self):
    "Calculates permutation importance by shuffling a column on a percentage scale"
    print('Getting base error')
    base_error = self.learn.validate(dl=self.dl)[1]
    self.importance = {}
    pbar = progress_bar(self.x_names)
    print('Calculating Permutation Importance')
    for col in pbar:
      self.importance[col] = self.measure_col(col)
    for key, value in self.importance.items():
      self.importance[key] = (base_error-value)/base_error #this can be adjusted
    return OrderedDict(sorted(self.importance.items(), key=lambda kv: kv[1], reverse=True))

  def ord_dic_to_df(self, dict:OrderedDict):
    return pd.DataFrame([[k, v] for k, v in dict.items()], columns=['feature', 'importance'])

  def plot_importance(self, df:pd.DataFrame, limit=20, asc=False, **kwargs):
    "Plot importance with an optional limit to how many variables shown"
    df_copy = df.copy()
    df_copy['feature'] = df_copy['feature'].str.slice(0,25)
    df_copy = df_copy.sort_values(by='importance', ascending=asc)[:limit].sort_values(by='importance', ascending=not(asc))
    ax = plt.barh(df_copy['feature'], df_copy['importance'])
Now we can go ahead and run this code. I'm going to create an instance of the PermutationImportance class, passing into it the trained neural network, the first 1000 rows from my data frame, and set a batch size of 64. You can feel free to input more or fewer rows from the data frame and modify the batch size if you want to see what impact that has.
res = PermutationImportance(learn, df.iloc[:1000], bs=64)
That should have output a bar chart with your feature weights.
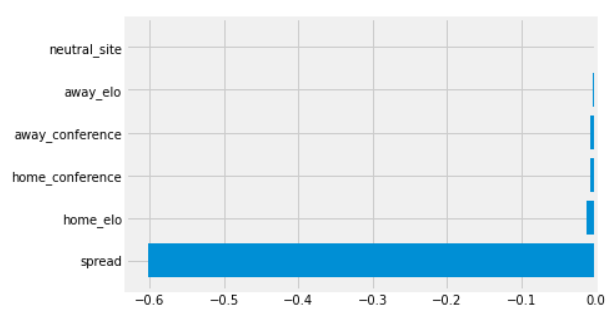
It's important to note that these values can be positive or negative based on the correlation they have to the final output. A large negative value has the same weight as an identical positive value, just in the opposite direction. So it's absolute values you want to account for when comparing two features. You can see here, in this very simplistic neural network, that the Vegas spread has by far the largest impact in determining the final output of the model. By contrast, the neutral_site flag has barely any weighting in the final output. Since spread is a huge outlier here, it might be helpful to view the raw values of the weights to see how the other features compare relative to one another. We can view that data by running this line of code:
res.importance
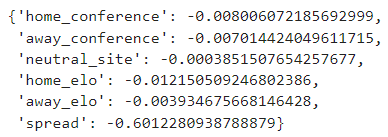
Oddly, home_elo appears to have much more weight than away_elo while both home_conference and away_conference have similar weights. As noted above, neutral_site has by far the least amount of importance in determining the final scoring margin.
And that's about all there is to it.
Next Steps
If you've followed any of my guides before, you will know that I always like to end these with some next steps to take. This was a very short post in which we really only scratched the surface. In reality, your own models are likely going to be much more complex with many more features than the example we just went through.
So the question is, what do we do with this information? Figuring out your feature set is always a lot of trial and error, looking to see what improves your model. Having something like this at your disposal makes it a bit less of that. You can see what features are contributing the most to the model's final output. What happens if you remove one or some of the features that are at near 0 importance? What about adding a new feature? Often, it can be hard to tell if a new feature really improves a model due to the randomness in neural network training algorithms and that black box we talked about earlier. Now you can get immediate information on how a new feature really affected your model based on the importance score that gets generated. If it's a near-zero score, then perhaps it's just adding noise, but if it's a high positive or negative score, we know that it added value in determining the final output.
I am very excited to incorporate this both into building future models as well as going back and evaluating some of my older models. I highly encourage you to do the same next time you are building a neural network of your own. And good luck!