The Four Quadrants of College Football
College football can be confusing.
It feels like a 13 game regular season can have so many twists and turns that the team you are watching at the end of the season hardly resembles the one in September.
So how can we properly group teams to assess their performance?
The odds.
The Four Quadrants: What are they?
As a continuation of a previous analysis I did on college football odds, we can go a step further by classifying each team into one of four quadrants.
Using two variables, the closing point spread and the amount each team covered the spread by, we can start to see things more clearly.
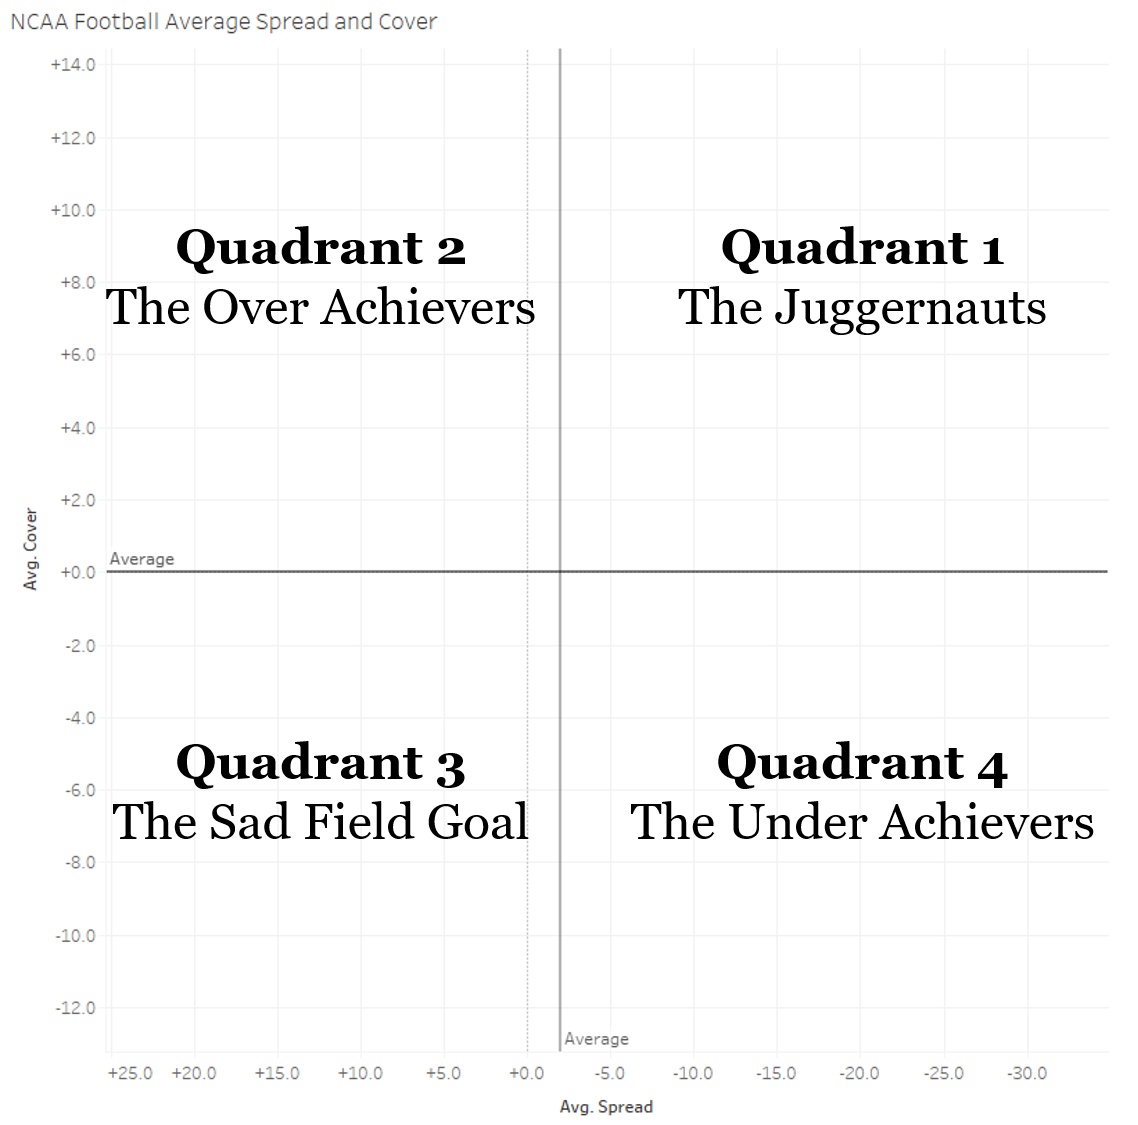
Quadrant 1: The Juggernauts
The Juggernaut teams are those that were both heavily favored to win (on average), and actually exceeded these high expectations by covering the spread.
The teams in this quadrant are found in the top right.
Quadrant 2: The Over Achievers
The Over Achievers were underdogs on the point spread but consistently covered this spread.
The teams in this quadrant are found in the top left.
Quadrant 3: The Sad Field Goal
First off, what is a Sad Field Goal ("SFG")?
A SFG is when a team is getting blown out and happens to drive into field goal territory at the end of the game. Kicking a field goal means absolutely nothing in terms of the outcome of the game, but teams feel a need to put points on the board and end up with a Sad Field Goal.
Important attribution note: the Sad Field Goal was coined Ryan Nanni over at Everyday Should Be Saturday.
Quadrant 4: The Under Achievers
The Under Achievers were consistently favored according to the point spread, but also consistently failed to cover the spread.
You will find a lot more house hold names in this quadrant.
Which Quadrant Does Your Team Fall In?
Now that we have defined our four quadrants, we can see where each team landed for the 2019 regular season:
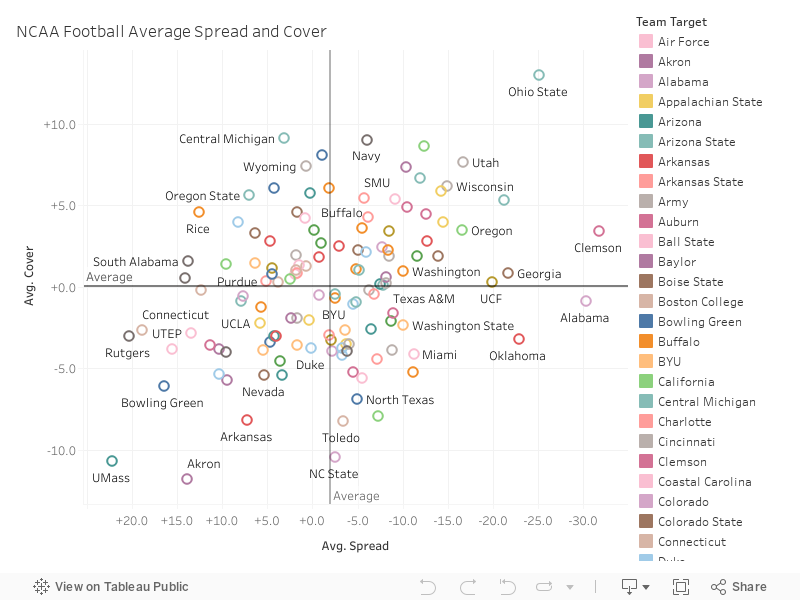
You can click on the team you are interested in on the legend on the right to highlight them on the graph.
Let's go through each quadrant and highlight some interesting teams:
The Juggernauts: Ohio State and Everybody Else
As you can see in the graph, nobody covered the spread like Ohio State did. They had the 3rd highest average point spread in the country at -25.1 (behind only Alabama at -30.3 and Clemson at -31.8) and covered that spread by 13 points on average.
For context, no other team in the country covered the spread by more than 10 points on average.
Clemson and LSU also stand out as they had huge spreads all year, but didn't cover like Ohio State did.
You could also make the case for Utah being in this class as they had the 5th highest average cover in the country at +7.7 while going up against an average point spread of 16.7.
The Over Achievers: Fire Up Chips!
The Over Achievers don't have a whole lot of story lines. Generally speaking, the worst teams (highest point spreads) tend to under perform.
This is why you see Quadrant 3 (Sad Field Goal) with such a large pull to the bottom left.
The only team worth mentioning in this quadrant is Central Michigan.
Central Michigan had the 2nd highest cover average in the country at +9.2 while sporting an average spread of +3.2.
Sad Field Goal: Chin Up, UMass and Akron
The SFG group consists of the teams that were expected to struggle. However what makes this group special is that they under performed their already low expectations.
UMass and Akron were in a class of their own here.
UMass had the highest average spread in the country at +22.2(!) while failing to cover by an average of -10.7 points, the 2nd worst in the nation.
Who had the worst average cover number in the country?
That honor goes to none other than Akron. Their average cover of -11.8 was worst in the country despite having an average spread of (only) +14.
The Under Achievers: What Happened Wolfpack and Spartans?
The Under Achievers are highlighted by two Power 5 teams: North Carolina State and Michigan State.
NC State had the 3rd worst average cover number in the country at -10.5, just behind two of the worst teams in the country in UMass and Akron.
Michigan State had only the 6th worst average cover at -7.9, however they were favored on average by -7.3 points compared to NC State's -2.5.
You will also see two powerhouses in this quadrant: Alabama and Oklahoma.
Alabama had the 2nd highest average spread in the country at -30.3 and pretty much played at that level.
Oklahoma had a similarly high average point spread at -22.9 but actually failed to cover on average by -3.2.
Notes
All data in the analysis was taken from the tremendous CollegeFootballData.com. Data is for all 2019 college football regular season games.