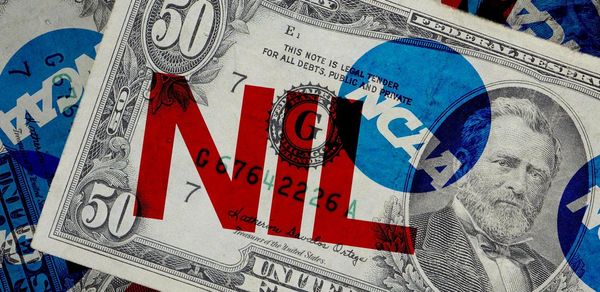
Analysis Lessons from picking the 2022 CFB Season As we reach the end of the 2021-22 college football season (the national championship game is unfolding on my TV as I type this), I wanted to take a look back at my performance in the College Football Data predictions contest. Minimum 400 games picked (not counting the NCG, but
Talking Tech Talking Tech: Applying LRMC Rankings to College Football, Part Two The previous post in this series covered how LRMC works and its mathematical implementation. Now it's time to take things a step further and apply this concept to ranking college football teams.
Talking Tech Talking Tech: Calculating SRS (Pandemic Edition) You might wonder, why is it so difficult to calculate some of these metrics? We have games and data, right? While that may be true, there are several factors that serve to complicate things this season.
Analysis Analyzing Variable Importance in CFB Machine Learning Models As always with machine learning models, a common question that comes up is “Why?”. Why did the model choose this team to win vs. the other? What variables are the most and least influential in a given predictive model? Time to take a deep dive.
Analysis CFBD: Using machine learning to predict game outcomes and spreads Predictive models for college football are a great application of machine learning techniques. Today, we'll look at one technique called gradient boosted decision trees using the LightGBM and NGBoost libraries.
Programming Making charts with Plotly and the CFBD Python library It's been awhile since I've done one of these. If you're familiar with my Talking Tech series, this entry will be much shorter. If you follow me on Twitter, you may have seen that the official CFBD Python client library dropped this past weekend. Introducing the official CFBD Python client
Analysis The Four Quadrants of College Football College football can be confusing. It feels like a 13 game regular season can have so many twists and turns that the team you are watching at the end of the season hardly resembles the one in September. So how can we properly group teams to assess their performance? The
By The Numbers By The Numbers: Previewing the National Championship Game Welcome to By The Numbers, a series in which I plan to preview upcoming games using numerical analysis. I hope to make this a regular feature starting next year. Since there are innumerable games to cover in a given year and only one of me, I am looking for people
Analysis Talking Tech: Charting Data with Plotly In the last edition of Talking Tech, we created our own rating system using an SRS algorithm. We're going to build off of that work to demonstrate how to plot charts in Python using Jupyter notebooks. Before we get started, we need to find a charting library that will suit