
Measuring Field Goal Kicker Efficiency

I was recently in a conundrum about the best way to go about measuring field goal kicker efficiency. This has been a topic of discussion in much of the college football content I follow, which is largely centered around the Michigan football team. For the past three years, Michigan has had the benefit of having perhaps the best special team tandems in school history. What MGoBlog has dubbed the "Pax Specialistica" consisted of Groza-winning kicker Jake "Money" Moody and punter Brad Robbins, both taken in this years NFL Draft. In the wake of Moody's departure, Michigan added Louisville transfer James Turner who has had a pretty solid career. He's not quite Jake Moody but then again it would be unrealistic to expect him to be so.
This has raised the question around the value of field goal kicking. Namely, what is the difference between an average college kicker and one who is at the upper echelon of college kickers? Expected Points Added (EPA), such as this site's own Predicted Points Added model, seems like a good starting point with how ubiquitous EPA metrics have become in the world of CFB analytics. As it turns out, however, existing EPA models are almost entirely unsuitable for providing field goal kicker metrics. We'll break some of the reasons for that down.
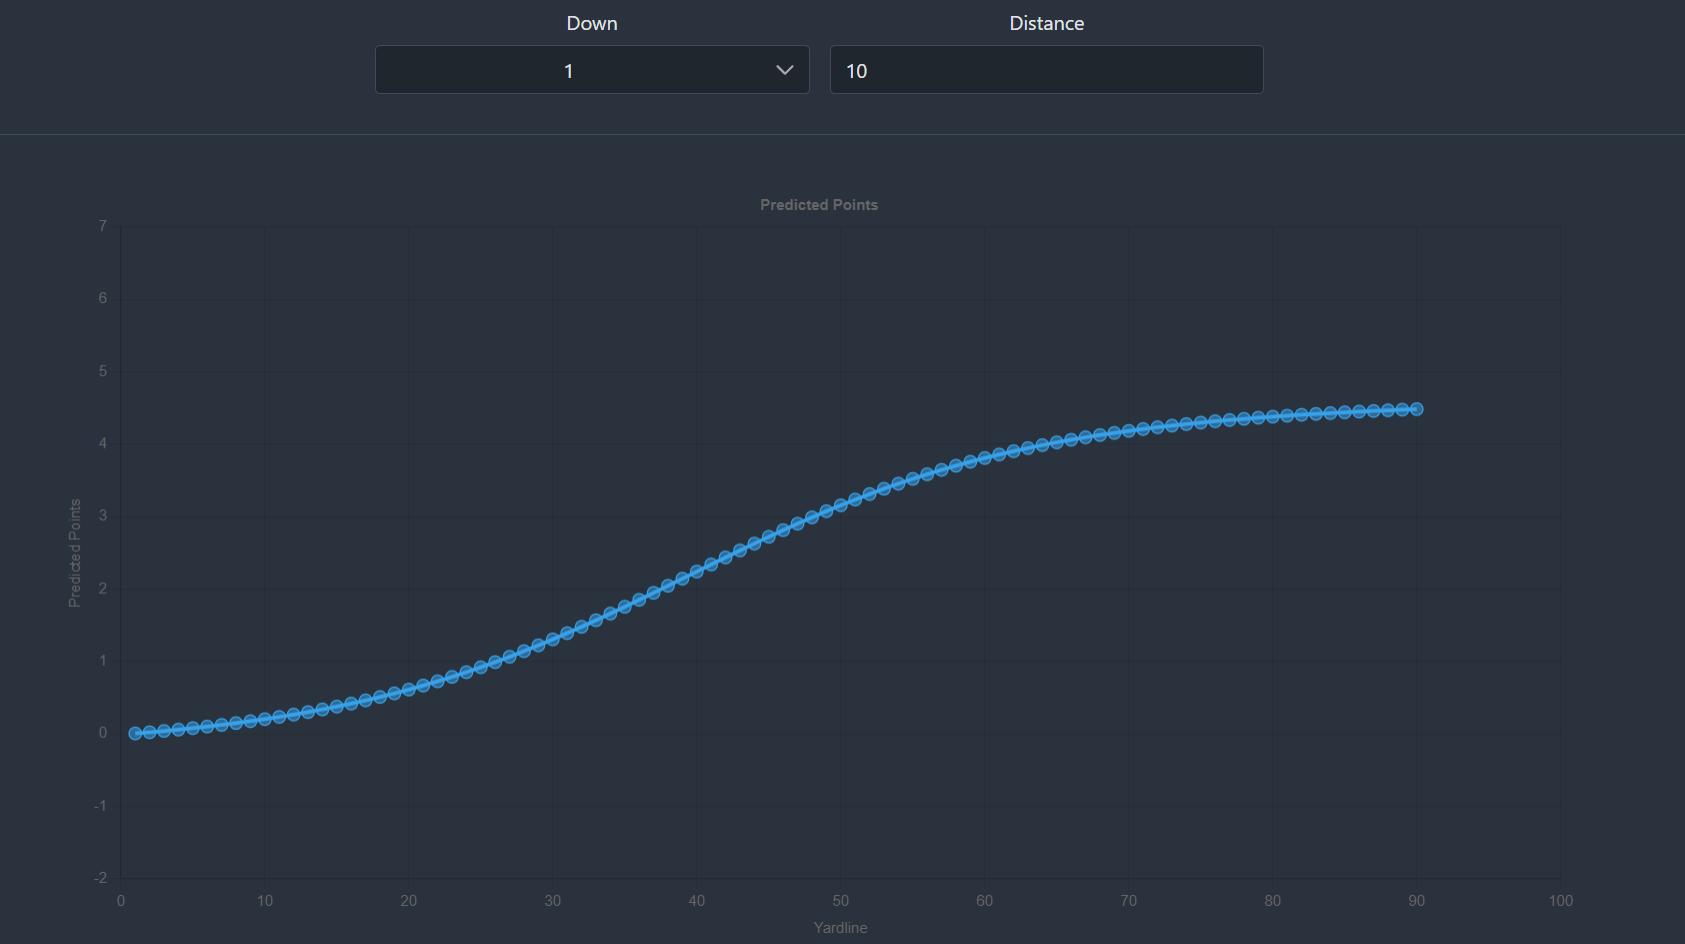
If you are reading this, I am going to presume you have some familiarity with EPA. If not, we'll do just a really quick breakdown of EPA since it's central to the discussion around the unsuitability of existing EPA models in evaluating this sort of thing. The basic premise of EPA is that each yard line on the football field is assigned an Expected Points (EP) value which variable based on down and distance. Because of this, you have an EP value at the start of each play predicated on the starting down, distance, and yard line. Each play results in a new EP value, either from scoring points or from the resulting down, distance, and yard line. You take the difference between the play's ending EP and the play's starting EP, you get the value of Expected Points Added, or EPA.
It might seem logical to apply this principal to field goal kicking and in certain contexts it certainly is. However, evaluating kickers is not one of them. Think about the factors that affect the difficulty of making a FG kick. Here are a few:
- Distance from the goalposts
- Wind velocity
- Wind direction
- Kick angle (e.g. from one of the hashes versus dead center)
Ideally, we would consider each of these factors when evaluating kickers. Unfortunately, we only have data for the first factor listed here, distance from the goalposts. Also note that down and yards to go are not listed here. Whether it is 1st down or 4th down, there is no material impact on the difficulty of the kick. It also doesn't really matter if it is 4th and 10 or 4th and 1. Since these are central features in traditional EPA models, it renders the ability of these models to measure kickers as very limited.
There's also another component to this. If a kicker misses a 50 yard field goal, the result of the play is a turnover on downs and great field position for the opponent. If a kicker misses a 20 yard field goal, there's still a turnover on downs but the opponent's field position is going to be pretty poor. As a result, the resulting negative EPA from missing a 50 yard kick will be much more extreme compared to the negative EPA resulting from missing a chip shot. This resulting EPA is still a valuable metrics in certain contexts, evaluating a coach's decision to attempt a FG vs going for it vs punting, for example. But it doesn't really make much sense to punish a kicker disproportionately more for missing a 50 yard kick than for missing a chip shot, does it?
A more sensible approach would be to take the one metric we have data for, field goal distance, and see how it correlates to field goal success. We could then use this information to spit out an Expected Points model for field goals based on kick distance. In fact, this is exactly what I did.
Methodology
For this exercise, I decided to query every field attempt dating back to the 2016 season. As we are currently a few weeks into the 2023 season, this is just over 7 seasons worth of field goal data. I then assigned each kick a points value of 0 (for a missed kick) or 3 (for a successful kick). While there have been several instances of field goals being returned for a TD by the defense, I decided not to count these as -6 point outcomes. For one, this category of plays is a miniscule sample. Additionally, the factors that lead to a Kick Six type of play are massively outside of the control of the kicker.
I should also note that I only included FBS attempts in the dataset. This means that the resulting metrics won't necessarily be applicable at other levels, such as the NFL or FCS. After aggregating this data and assigning a points value to each attempt, I then calculate the average points scored on field goal attempts based on kick distance.
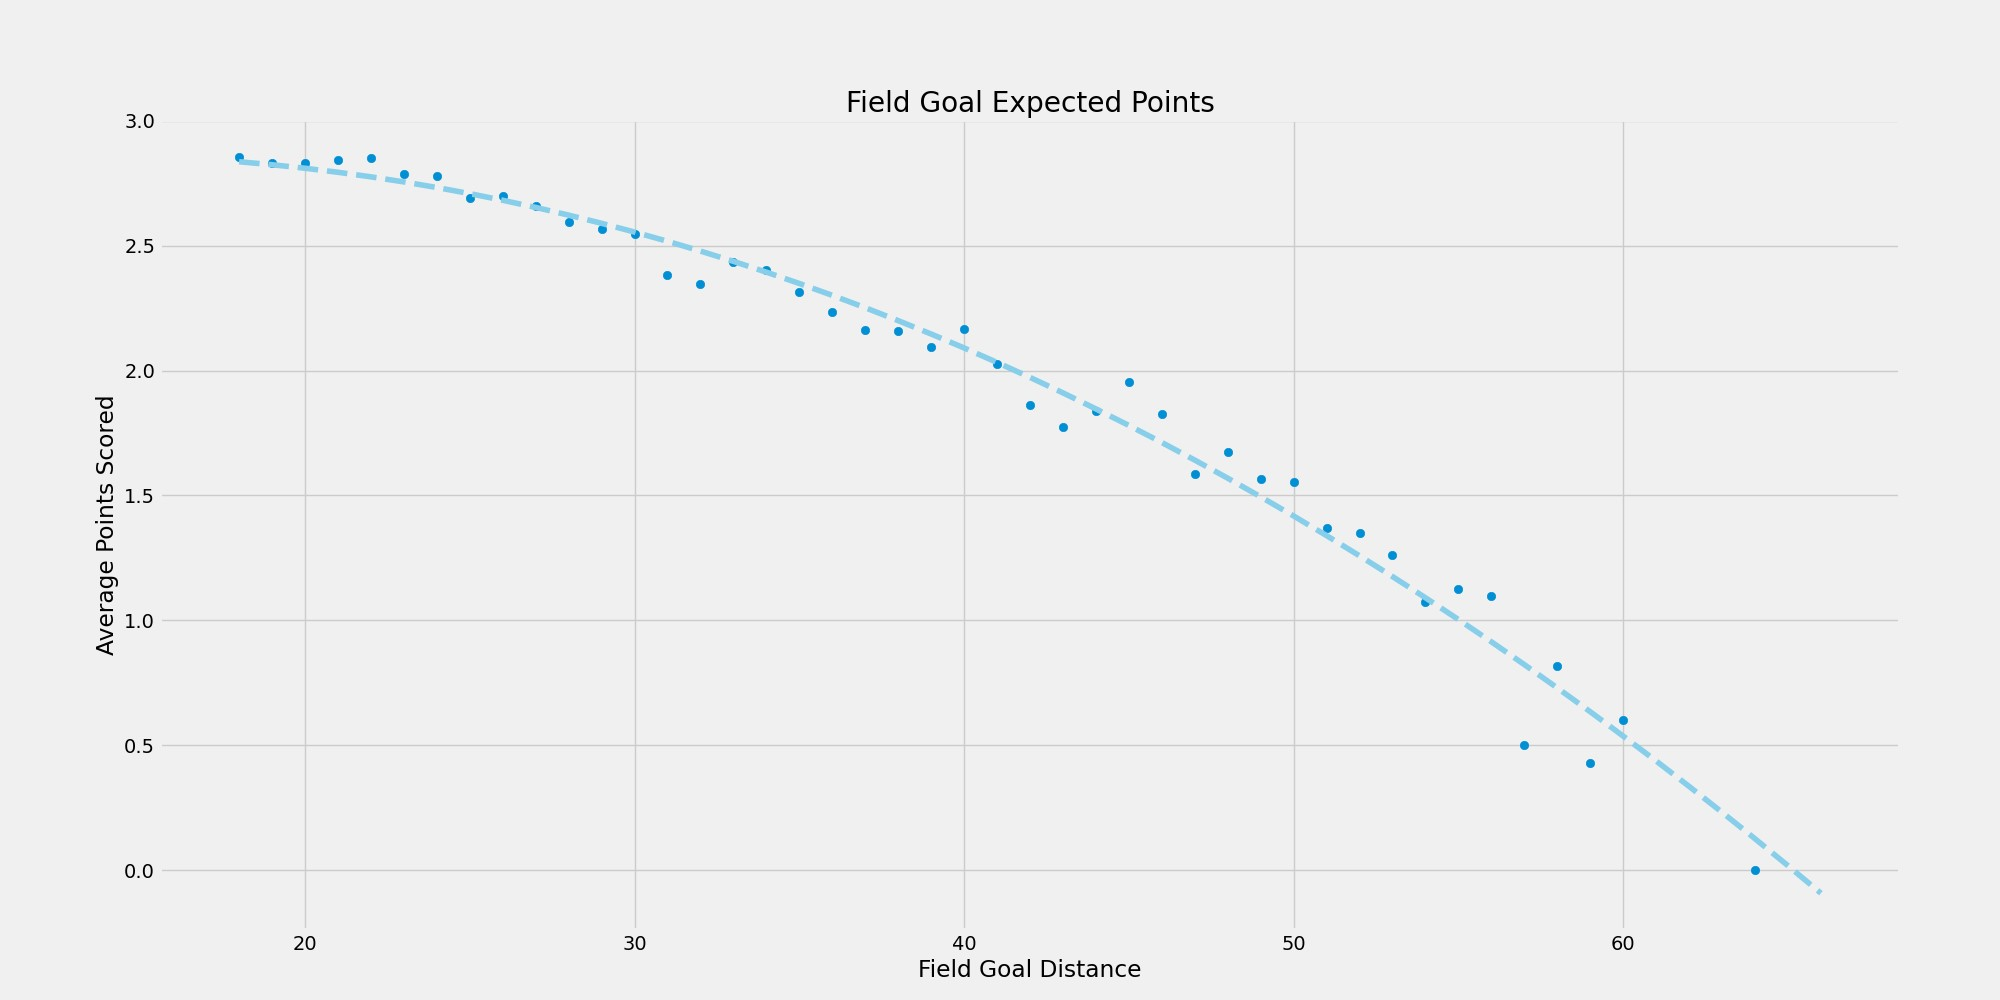
As you can see in the figure above, this gave a nice little trend that was easily fitted to a curve. The closest field goal attempts average out just short of 3 points per attempt and at a certain point. At a certain point, the expected value is functionally 0 points. I am using this curve to define expected points at the FBS level for a field goal at a given distance.
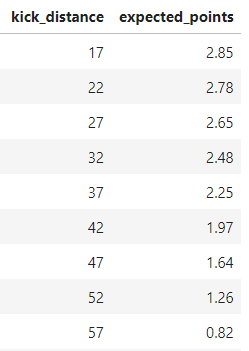
I am also using this curve to define "replacement level" for field goal kickers. If a specific kick distance has an expected points value of 1.5, you would expect a replacement-level kicker to make that field goal about 50% of the time. Similarly, if the expected points value is 2.0, then a replacement-level kicker would be expected to make that kick 2 out of 3 times.
Using this concept, I've devised a metric called Points Added Above Replacement, or PAAR. To calculate PAAR, we look at each of a kicker's FG attempts and find the difference between the actual points scored by the kicker and the expected points based on FG distance. We then add these value up for each of a kicker's attempts. For example, here were the top 25 kickers in PAAR for the 2022 season.
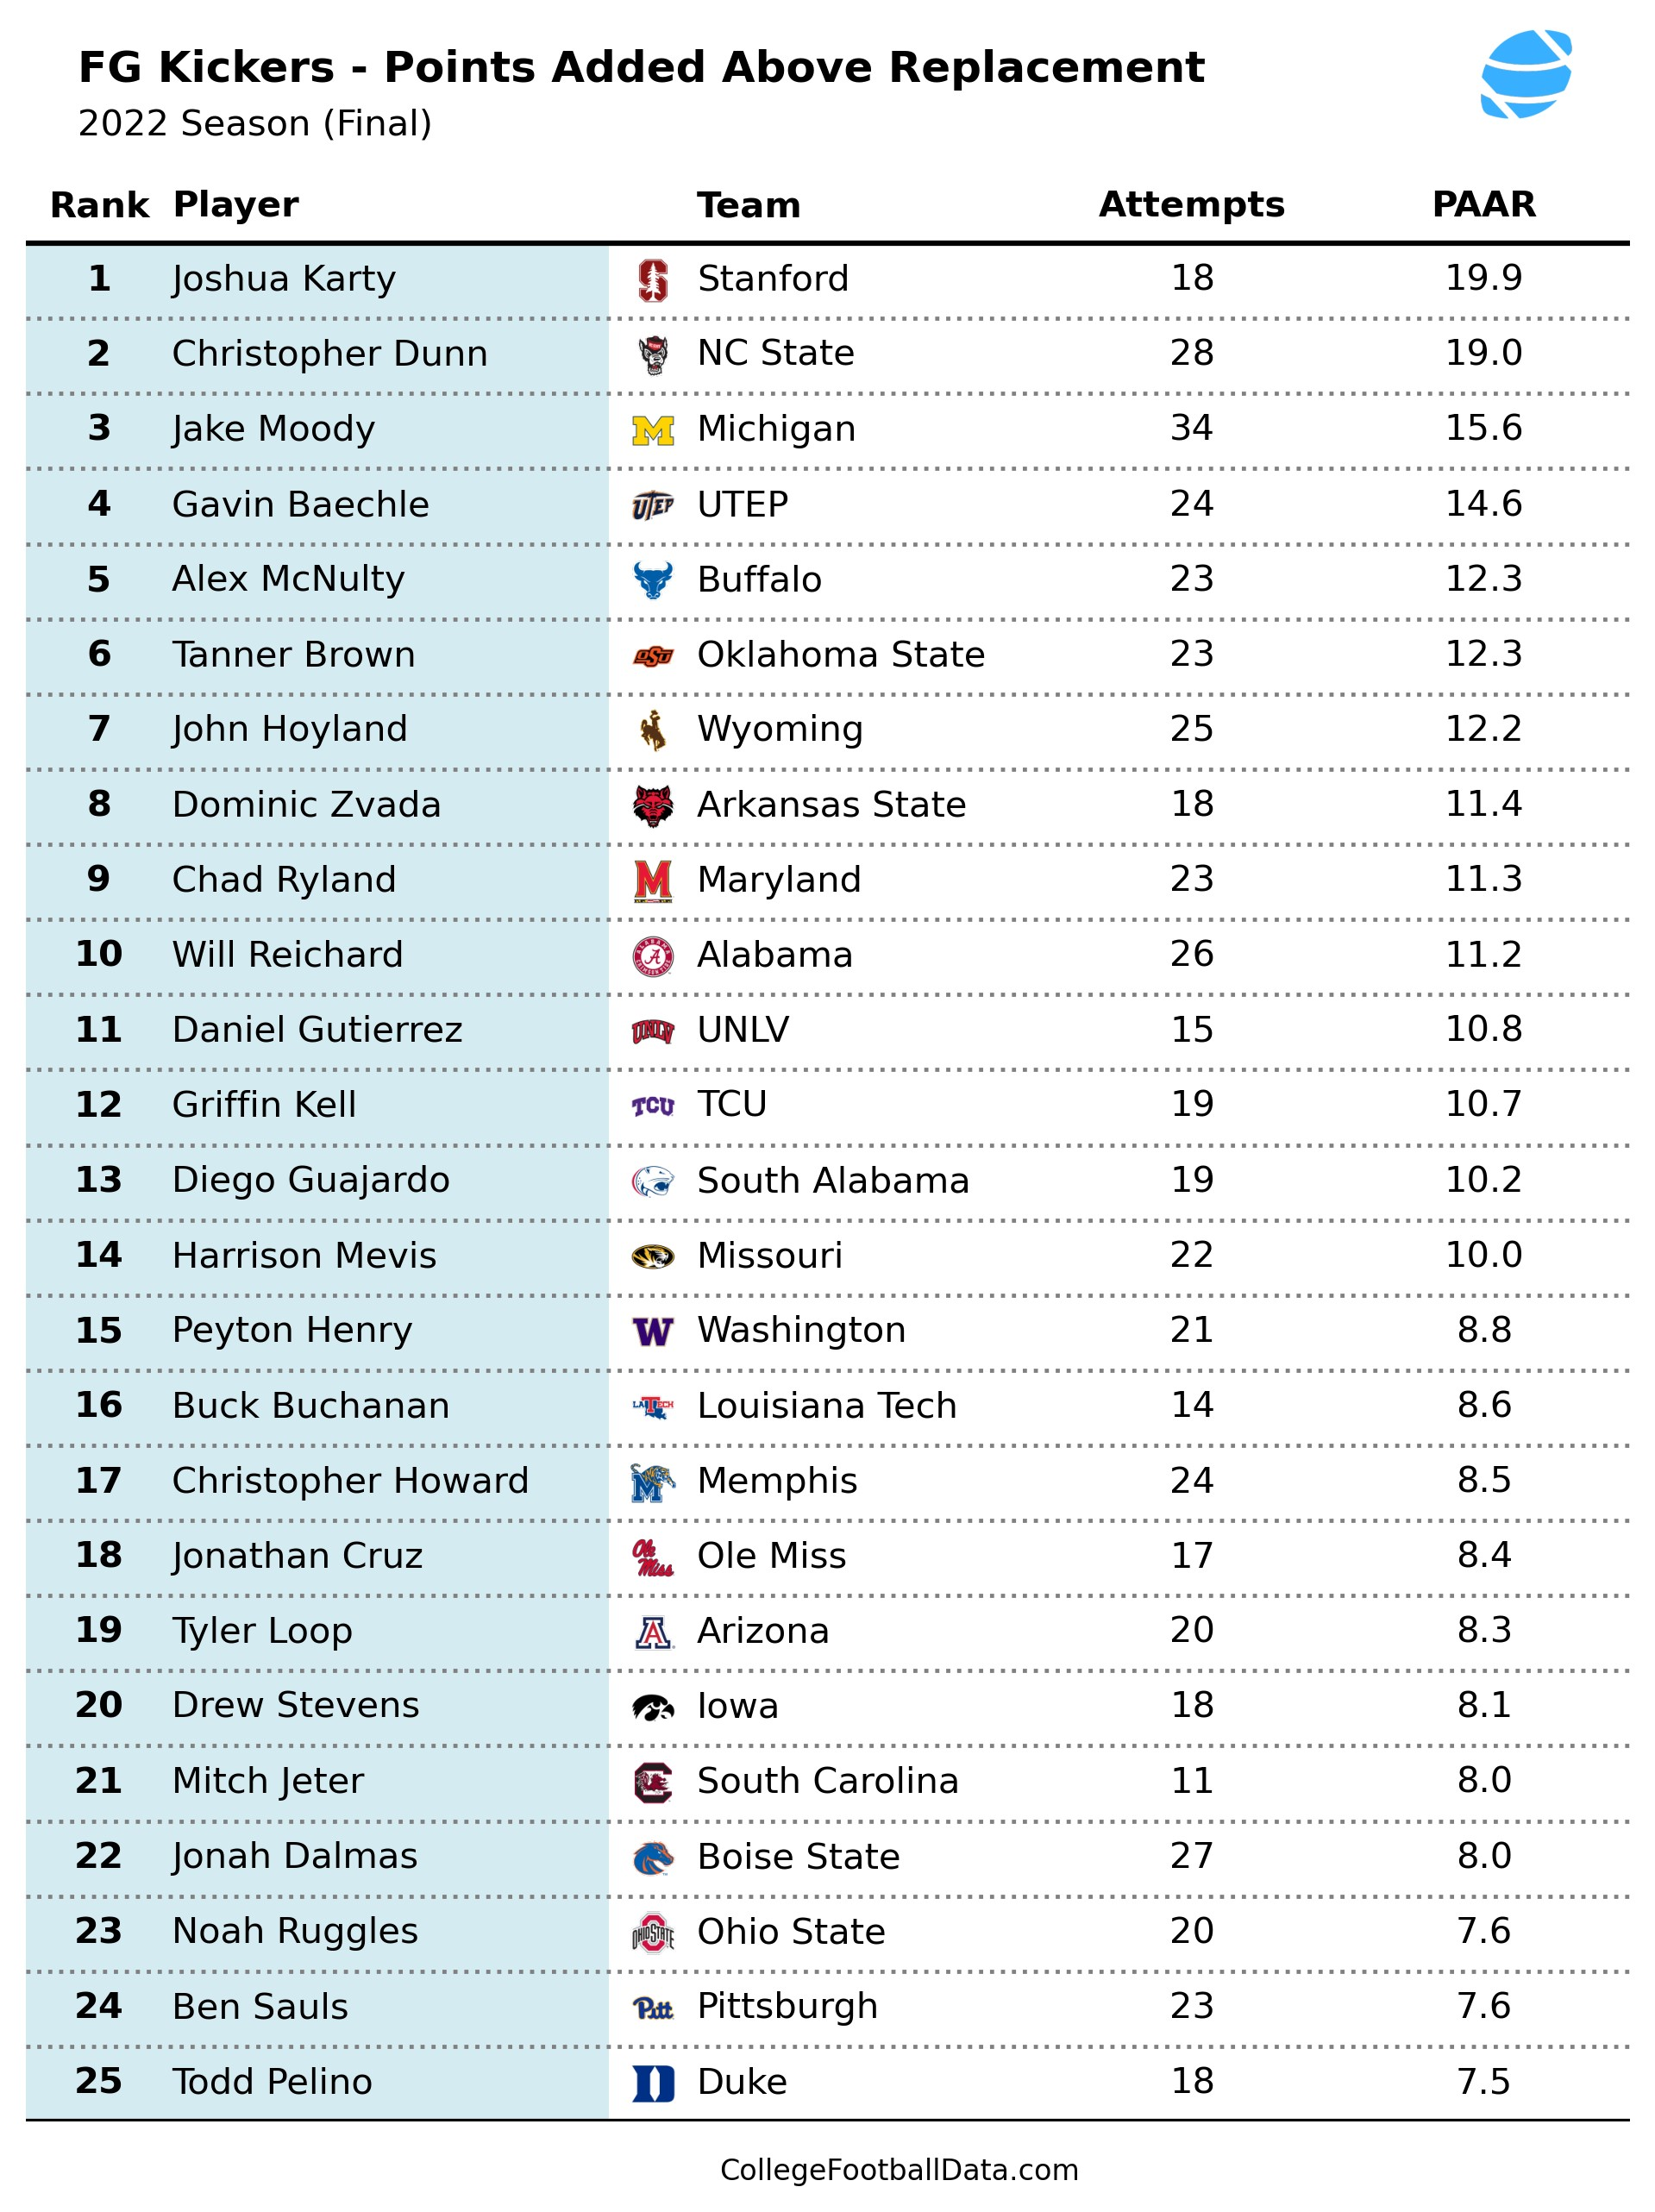
Looking at this chart, Jake Moody placed third in this metric behind Stanford's Joshua Katy and NC State's Christopher Dunn. Moody's PAAR value was +15.6. We define a replacement-level kicker as one who measures out at +0.0 PAAR, neither above nor below expectations. This means that, across all of his FG attempts for the 2022 season, Jake Moody scored 15.6 more points than a replacement-level kicker given the the same attempts. That is more than two TDs over the course of the season. Or put another way, he provided ~1.1 points per game over what would be expected for a replacement-level kicker.
Conversely, you can also have negative PAAR values. I hate to single out kickers since it's one of the toughest and highest pressure jobs on the football field, but here's the flip side of the above chart.
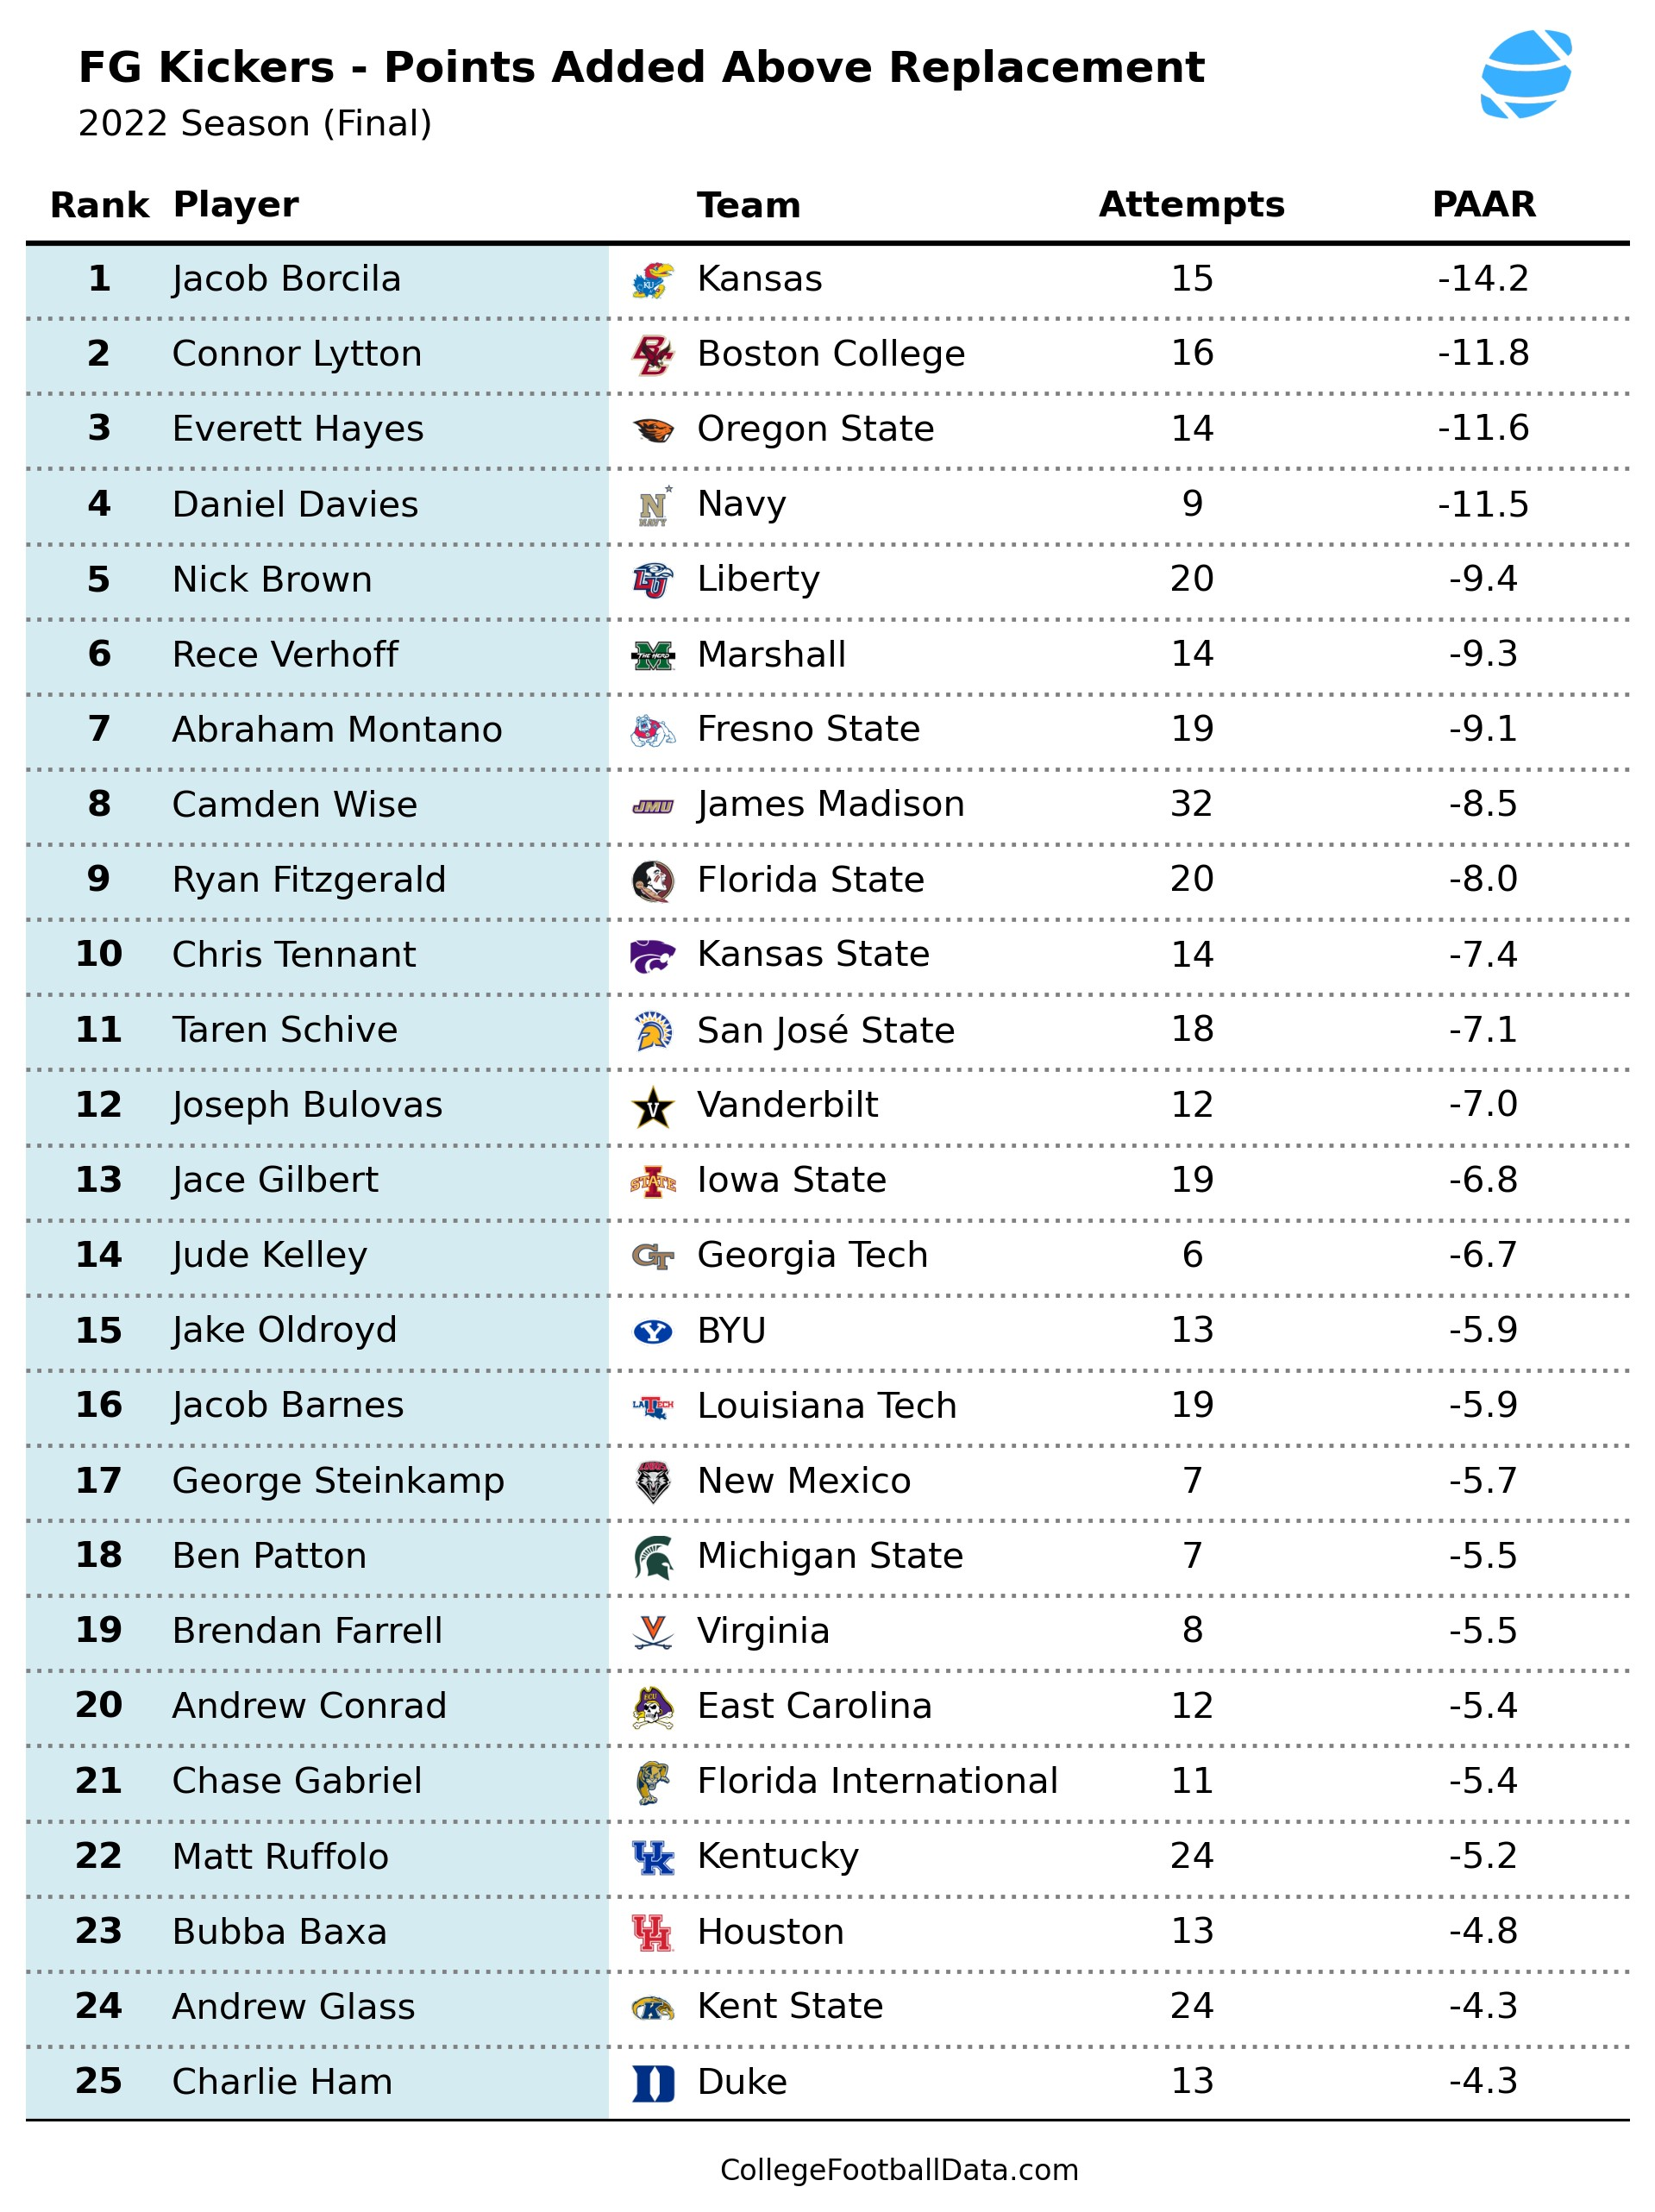
Kansas's Jacob Borcila netted -14.2 PAAR for the season. Accounting for each of his FG attempts, he scored 14.2 less points than would be expected for a replacement level kicker. Compare with Stanford's Joshua Karty at the top of the previous table with +19.9 PAAR. The difference between the top kicker and the bottom kicker from last season was a whopping 34.1 points, or just under five TDs! Kicking is important.
Other Applications
I argued at the start of this that traditional EPA models aren't suitable for measuring kicker performance, but that doesn't mean they are altogether useless. We can combine this new FG expected points model with our traditional EPA model to visualize when it might make sense to go for a 1st down or TD versus attempting field goal.
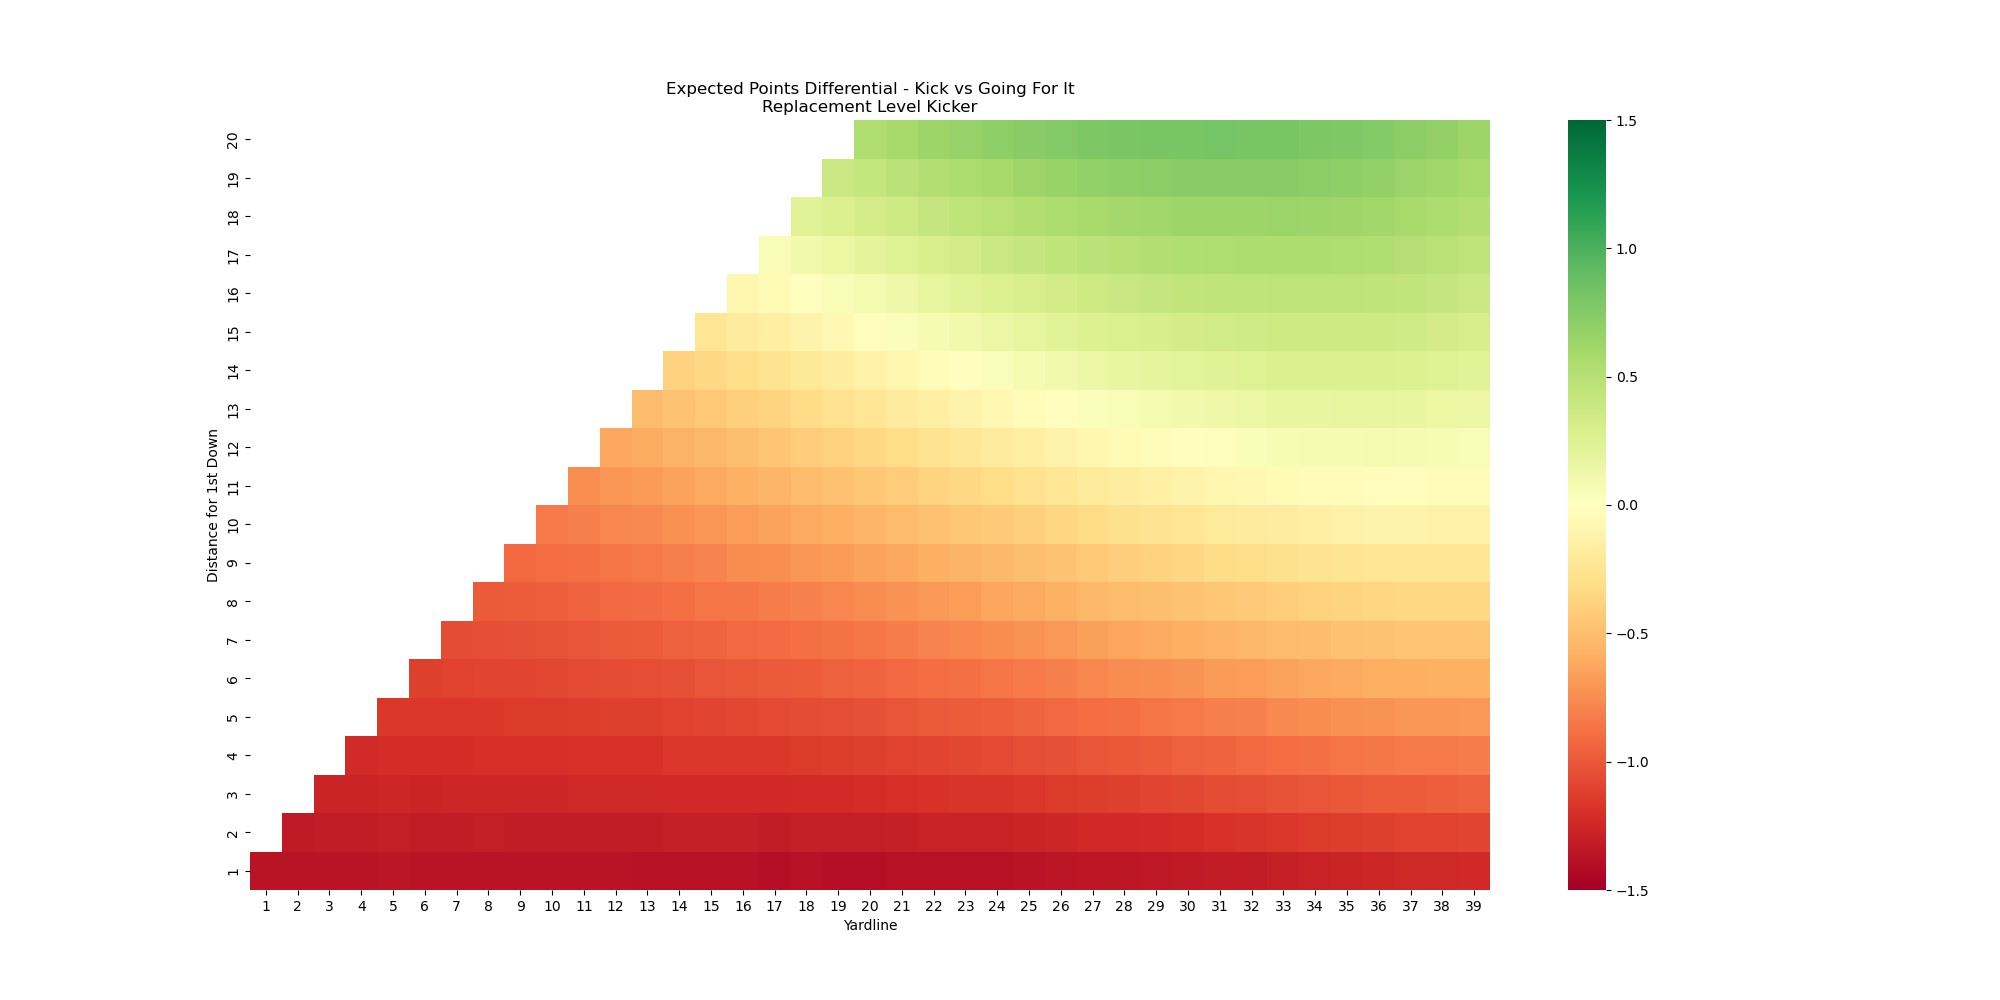
This heatmap illustrates the expected point differential between kicking a FG with a replacement-level kicker and the current expected points based on the distance to go and the yard line. Situations where there is more value in attempting a FG are shaded green whereas the redder areas are where points are being left on the table in deciding on a FG attempt. We can contrast this with the chart for an elite kicker.
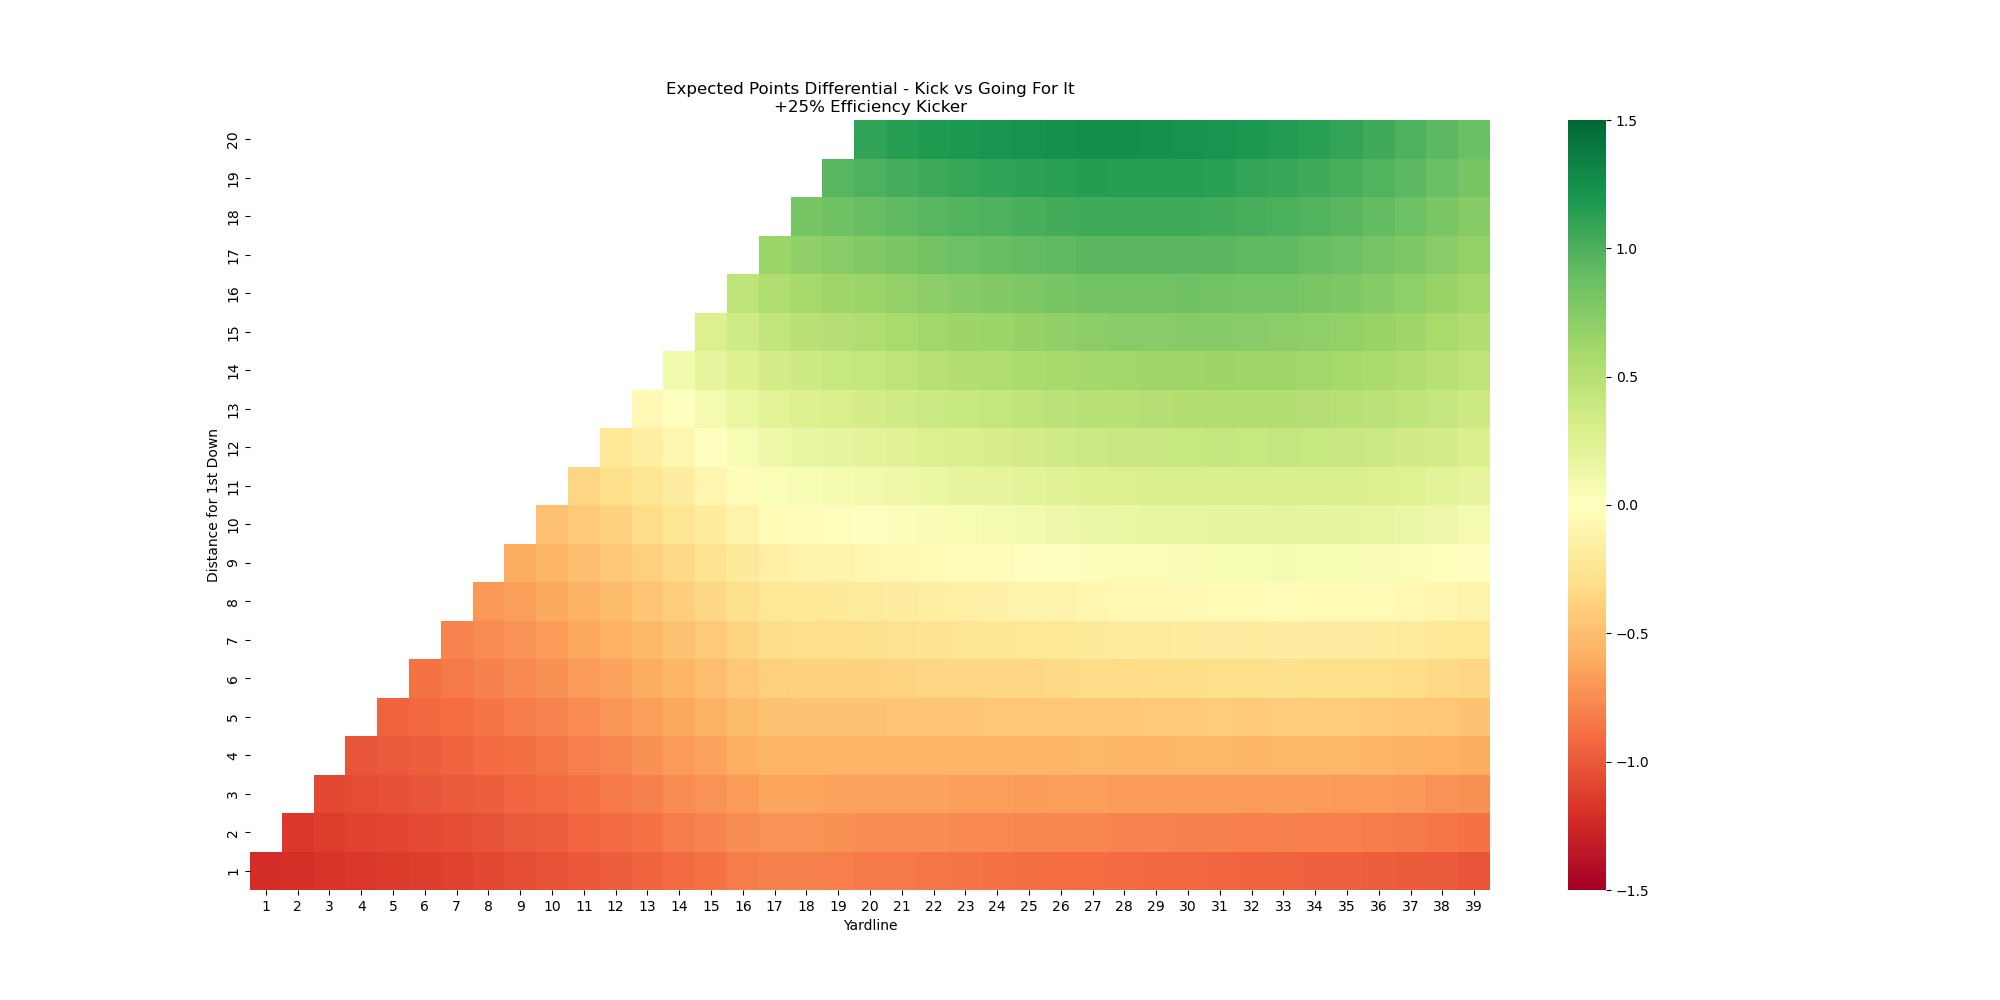
See how much greener this chart is than the previous one? Having an elite kicker makes the decision to attempt a FG versus going for the TD or 1st down an easier one since you have greater confidence in actually getting points with a FG attempt. Now, let's check out the chart for a kicker who is far below replacement level.
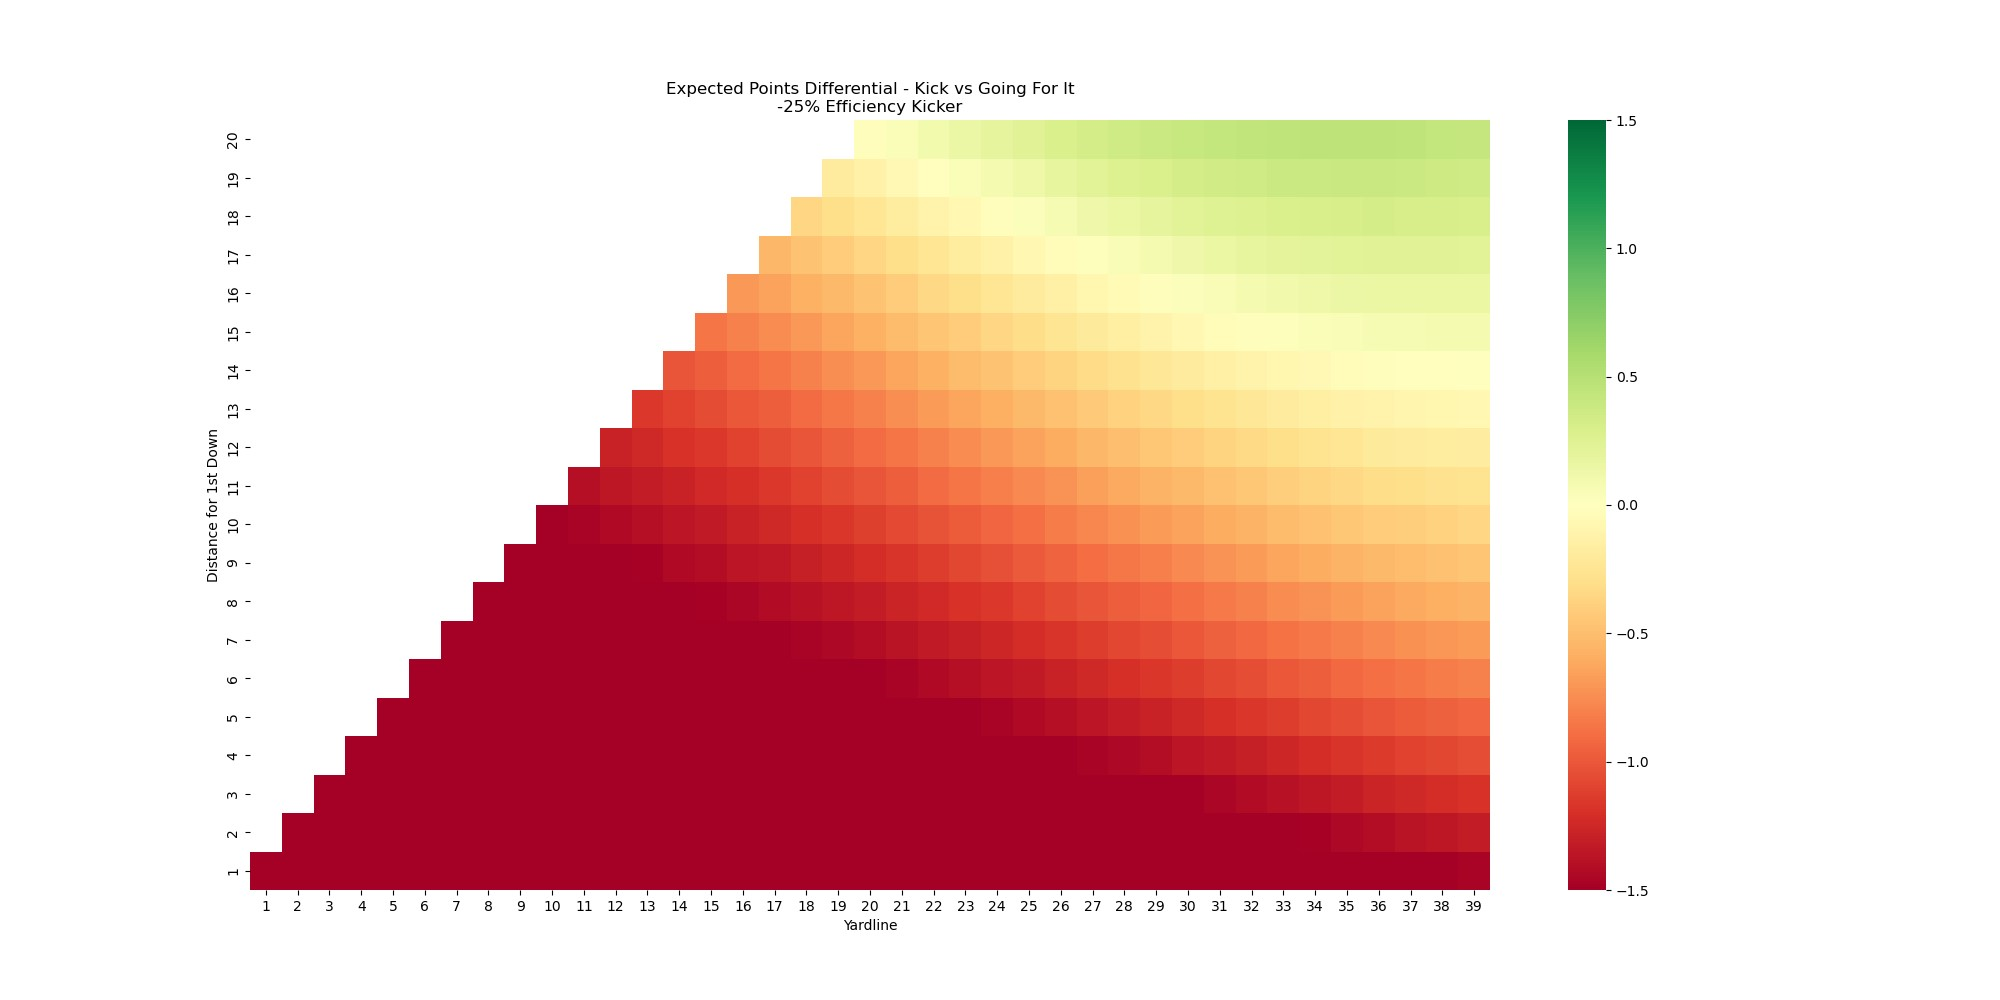
A lot more red there. You're probably much better off taking your chances and going for it rather than attempt a FG. This is somewhat of a simplification since this isn't always a binary choice. The option to punt exists and should ideally be included in the calculus here. That said, I think the point is pretty clear on the value of a good kicker and how much an elite kicker can open up options and make decisions easier.
Conclusion
Hopefully, this gives a clear idea on how we can go about evaluating kickers. I'm very excited to share the PAAR metric and start utilizing it. I plan on posting updates throughout the course of the season. And in case you missed it, I've backfilled and am now including FG kickers in player-play stastistic data so you can now track inidivual kickers at the play level and devise some metrics of your own. Next steps for me are making some of this stuff, like PAAR and FG EP, available on the site and API. Then, it's onto punters!
As always, feel free to reach out and let me know what you think on Twitter, Discord, or Reddit.