Getting Started with CFB Analytics

The 2022 season is about to be upon us and you are looking to get into CFB analytics of your own, like creating your own poll or picks simulator. Or maybe you've largely used spreadsheets and are looking to graduate to something that gives more capabilities and flexibility. Perhaps you've created models before and are just looking to learn. If any of this sounds familiar, then read on! We'll be walking through everything from picking a programming language to how to use CFBD to get data and manipulate it.
First things first
It can be easy to get discouraged or question whether you have what it takes to take the next step. Don't be. You don't need a Ph.D. in statistics or be a professional software engineer to pick this stuff up. I'm a firm believer that everyone is: 1) capable of learning how to program and 2) capable of drawing insights. It is true that there are a lot of talented people in the sports analytics community, but you don't need to be a data scientist at ESPN or an analyst at PFF to add value. Everyone got their start from somewhere and everyone has different motivations. Some people might want to create things they can share widely. If that's you, then be prepared for constructive criticism and use that constructive criticism as a learning opportunity. But maybe you just want to create something for yourself and that's perfectly valid as well. No matter your experience level or motivations, the CFB analytics community is a welcoming one. We're all here to learn from each other and build off of each other's work.
Programming Languages

This can be a daunting decision as there is such a wide and diverse multitude of languages and frameworks. In spite of what some may say, there is no singular programming language that is obviously better than every other programming language. Just about every mainstream language comes with its own community, tools, frameworks, and libraries. The best language to use is the one with which you are already familiar. For the purposes of this guide, we're going to assume you're starting from scratch.
Like I said, most any mainstream programming language will do just fine if you are just starting out, though there is some nuance to the pros and cons of each language. I spent the first several years of my sports analytics journey programming exclusively in JavaScript and C#. These are both great languages to use for just about anything as they are always among the most popular programming languages. That said, there are a few languages that are favored by the community so let's dig into those a bit.
The first is called R and is more traditionally used by data scientists. The whole purpose of R is math and data analytics. These are its singular focuses. As such, it doesn't have much extensibility beyond data science tasks. It is also a more difficult language to learn because it is a very niche language that doesn't follow many standard programming paradigms that you will find in most other languages. The tooling around R is also severely lacking in comparison to other stacks. For these reasons, I generally don't recommend using R unless you already have a lot of familiarity with it and don't plan to branch out your programming beyond data analytics. That said, if your hope is to jumpstart a career in data analytics, it is an essential skill to know. So again, it all depends on your motivations.
The other language that has a lot of traction within the community is called Python. Python is a general-purpose programming language that can do just about anything. You can script tasks and scrape websites with it. You can also build your own web apps, bots, and just about anything using Python. It is also the native language for most mainstream libraries used in data analytics, artificial intelligence, and machine learning. Python is a language that is often taught in introductory college programming courses to students who have no prior programming experience. Because of all these factors, it is a pretty natural choice if you are just starting out. There's also a native Python library for interacting with the CFBD API, so that's another plus. It's a great choice if you plan to use it exclusively for data analytics tasks, but especially so if you plan to branch out into other software engineering tasks like building web apps.
For the purposes of this guide, we'll be using Python the rest of the way. That's all well and good, but you may still need to learn it and this guide would be sort of pointless if it didn't point you to some resources. You may have heard of Kaggle. If not, Kaggle is a website that specializes in data science competitions. They also have a whole section of interactive data science courses, which also includes a whole course dedicated to learning Python. Once you're done with the Python course, if you're like me and need something that's a little more interactive and learning by actually doing then I can't recommend the rest of their courses enough. The Python Software Foundation also has its own section on learning resources that you can check out.
Accessing CFBD with Python
So let's say you've learned some basic Python and are ready to start digging into some college football data. Now, there is a multitude of data sources out there. My whole purpose for building this here website and API was to aggregate just about any type of CFB data you could think of in a centralized place. Some people still strongly prefer to build out their own web scrapers and that's totally valid. In fact, building a web scraper is a good learning opportunity so I strongly recommend building one of your own at some point. However, my whole intent was to make acquiring that data much easier using a fraction of the time and effort. And I assume that's why you're here!
The first thing you'll need to do is get an API key, which is totally free. It will require an email address to receive your key. If you are a Patreon subscriber, be sure to use the same email that's associated with your Patreon subscription to ensure that any Patreon benefits get synced up with your key. You can register for a key on this page and you should have your key emailed to you almost immediately. Be sure to keep your key in a safe place and not to share it with anyone. It should be treated just like any other password.
The next step is to ensure you have a Python environment set up. This could be as simple as working in an IDE like VS Code or PyCharm. Or you can set up a full data science environment. Anaconda is a very popular choice that I've been meaning to check out. If you want to set up your environment like mine, here's a guide for how I have mine set up. I'm mainly going to be using Jupyter notebooks in this guide, but any Python environment should do.
We're going to be working with the official CFBD Python client library. As of this writing, there are official client libraries for Python, C#, and JavaScript. The nice thing about these libraries is that they are auto-generated API wrappers. What this means is that whenever changes are pushed to the API, these libraries all regenerate to reflect the latest changes to the API and pick up any brand new functionality. Installation is really simple just running pip install cfbd in a terminal window. If you already have the library installed, it's a good idea to update it every once in a while to pick up the latest changes by running pip install cfbd --upgrade.
If you've completed the above steps in acquiring an API key, having a Python environment set up, and installing the CFBD Python library, then you are more than ready to start diving into some code!
Retrieving Data
There are a couple of dependencies that I always import whenever I'm doing any kind of data work. In addition to the CFBD Python package, I always import NumPy and pandas. These are sort of the bread and butter for doing any sort of data loading and manipulation. Another library that is often essential is scikit-learn, but I don't plan on going into that in this post because it's mostly focused on things like regression and machine learning. Anyway, let's go ahead and import those packages. Be sure to install them with pip first if you haven't. If you're using a prebuilt environment like Anaconda or the one in my guide, then you probably already have them.
import cfbd
import numpy as np
import pandas as pd
Next, there's some configuring we'll need to do with the cfbd package to get it to use your API key. You'll need this block any time you use the package. Be sure to replace your_api_key on Line 2 with your actual API key. This code will instantiate an API configuration, tell it to use your key, and do some more configuring of the Authorization HTTP header.
configuration = cfbd.Configuration()
configuration.api_key['Authorization'] = 'your_api_key'
configuration.api_key_prefix['Authorization'] = 'Bearer'

api_config = cfbd.ApiClient(configuration)
Now let's say we wanted to grab a list of all FBS teams. That's pretty simple using the library.
teams_api = cfbd.TeamsApi(api_config)
teams_api.get_fbs_teams()
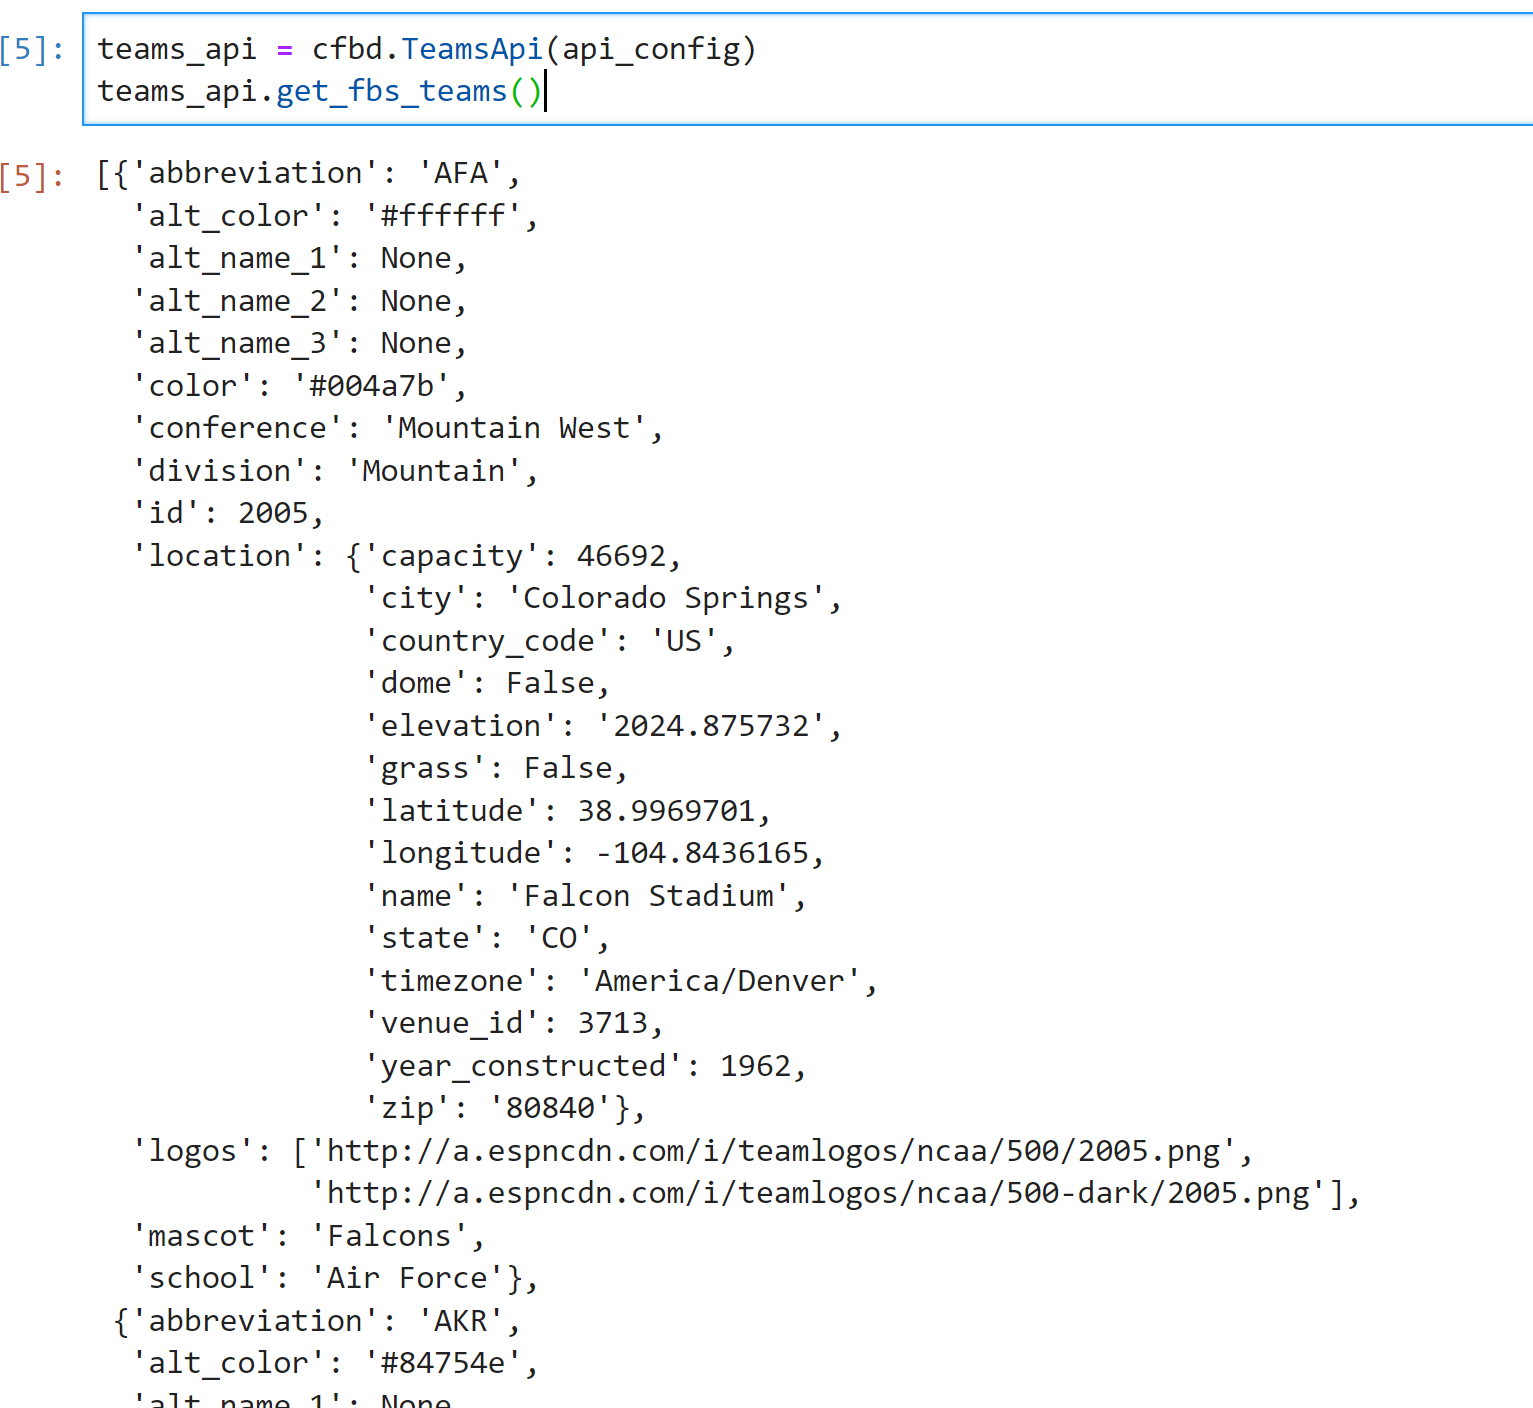
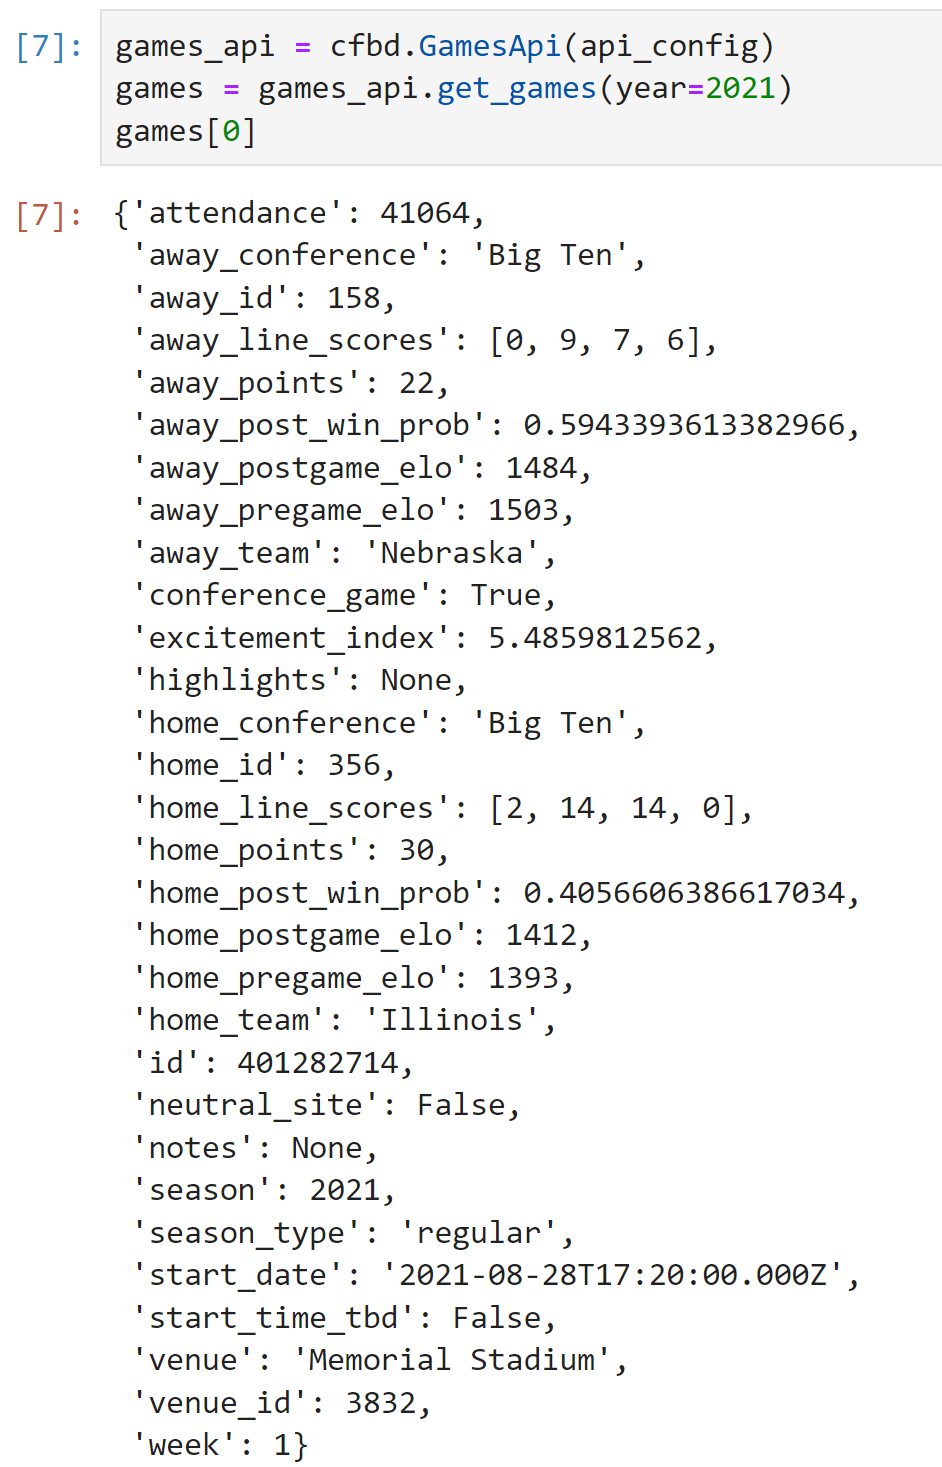
This returns the list of FBS teams along with all sorts of data pertaining to each team. To walk through what the above code is doing, in Line 1 it is creating an instance of the Teams API using the API configuration we created earlier. It is then using the Teams API instance on Line 2 to call the get_fbs_teams method. How would we go about getting a list of games and scores?
games_api = cfbd.GamesApi(api_config)
games = games_api.get_games(year=2021)
games[0]
If we wanted to do some calculations, we would want to load this game data into a pandas dataframe. There are two main methods to do so using the pandas from_records method. The first method seems the easiest on the surface but is not my preferred method.
df = pd.DataFrame.from_records([g.to_dict() for g in games])
df.head()
There are two reasons I don't like this way, even though it seems so simple. First off, it brings EVERY data point into a dataframe. When you may only be working with a few data points, all those extra columns fill up the dataframe with data you don't care about and make it more difficult to read. Secondly, and I get this question a lot from beginners, the data isn't always flat and is sometimes nested in several layers. In these instances, the above code doesn't work as cleanly when there are nested data points you wish to bring in. So, I prefer to specify the data points I care about while building a dataframe. So let's say I want to pull in the home team name, away team name, and the point totals for each team.
df = pd.DataFrame.from_records([dict(home_team=g.home_team, home_points=g.home_points, away_team=g.away_team, away_points=g.away_points) for g in games])
df.head()
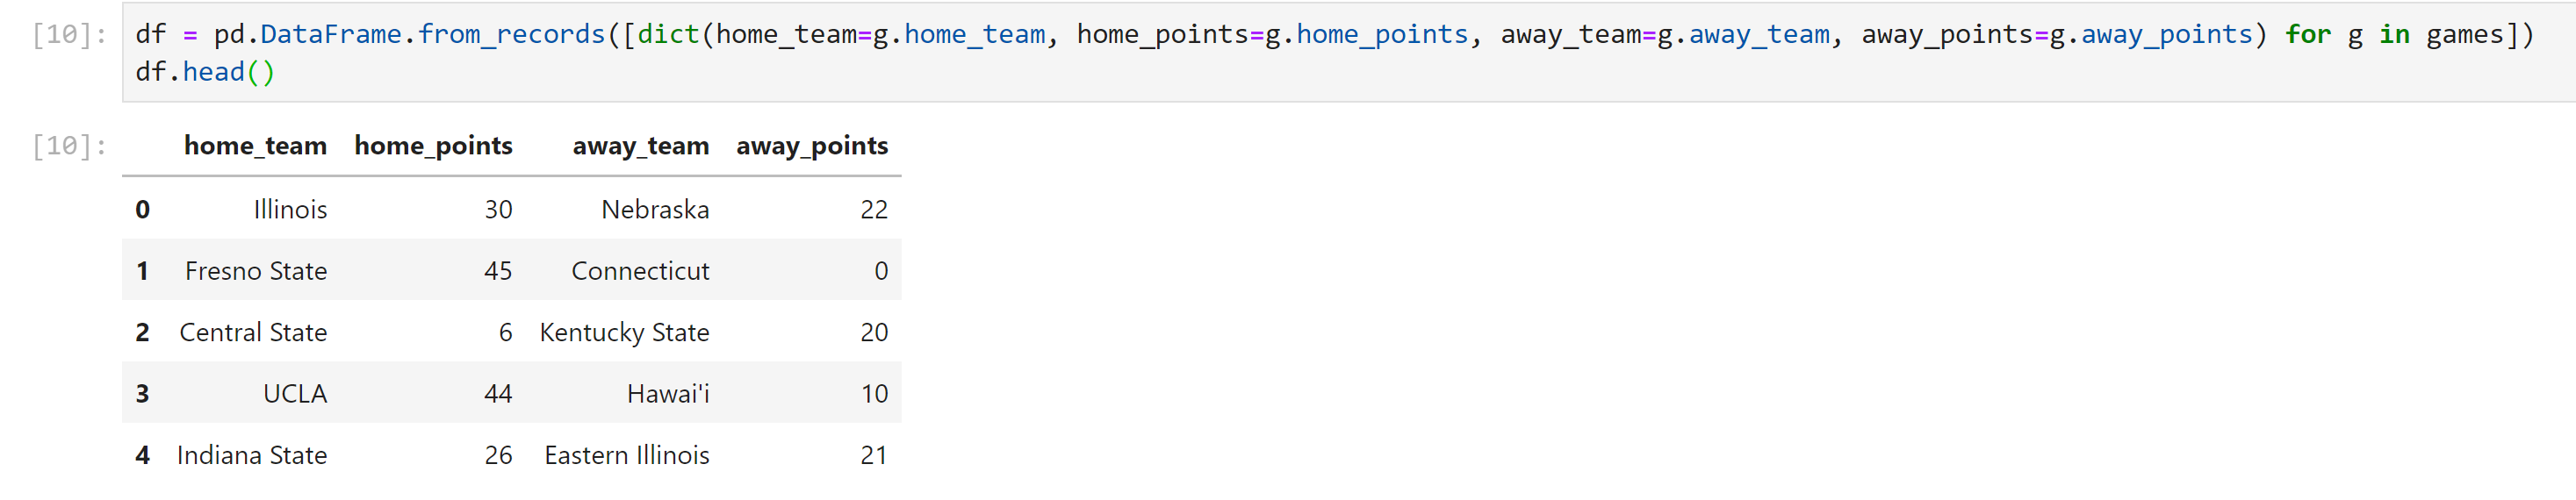
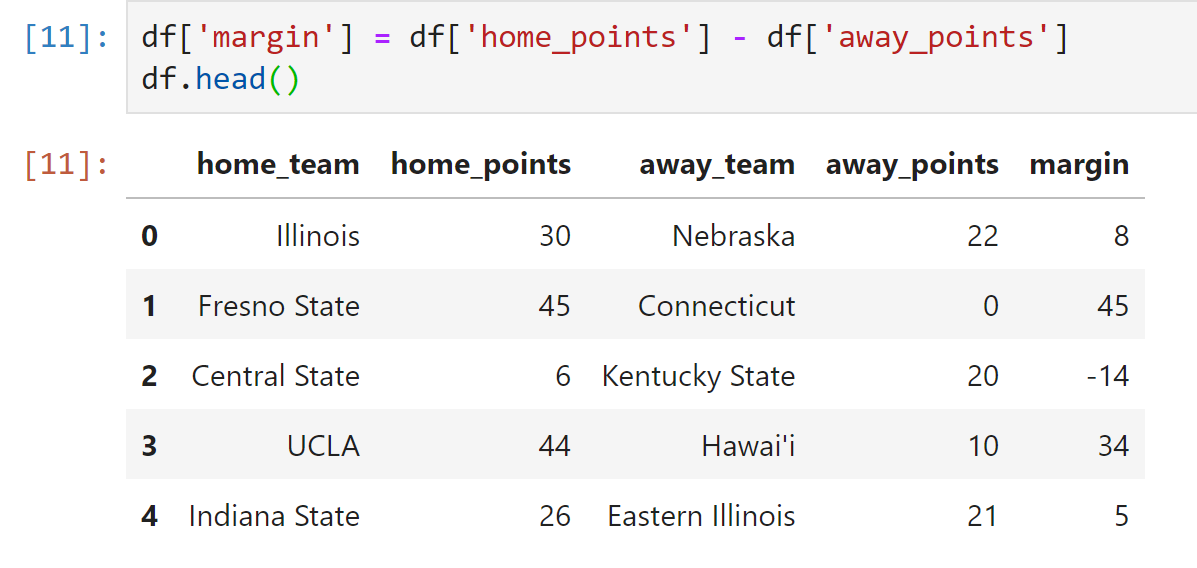
I had to write a little bit more code, but my dataframe comes out much cleaner and easier to understand. Suppose I wanted to calculate the final scoring margins for each of these games.
df['margin'] = df['home_points'] - df['away_points']
df.head()
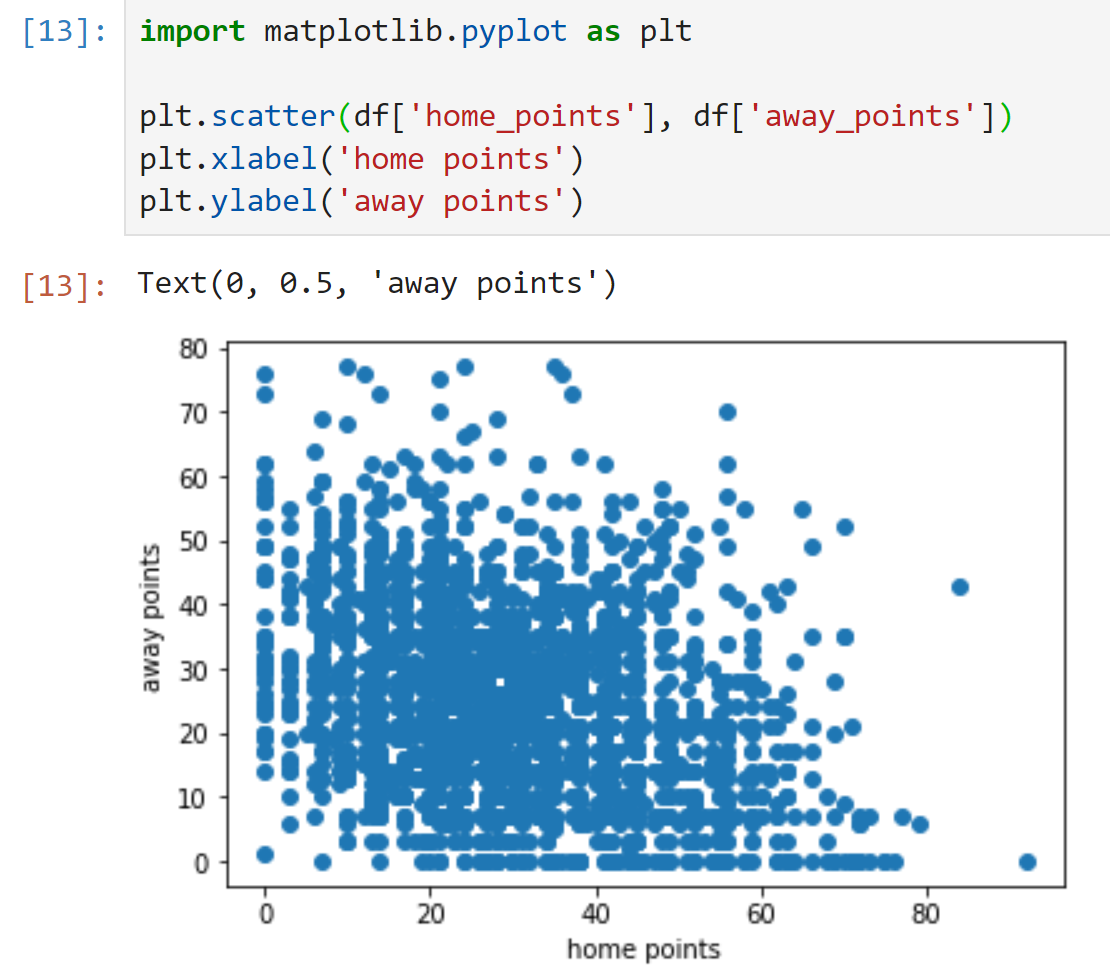
Pretty simple, right? Let's throw some data into a chart. There are several different chart libraries out there. I used to use Plotly (and even have a post on this blog on it) but these days prefer matplotlib. As with all things, what library to use largely comes down to personal choice. I'm going to import mathplotlib and create a simple scatter plot of game scores using the above data.
import matplotlib.pyplot as plt

plt.scatter(df['home_points'], df['away_points'])
plt.xlabel('home points')
plt.ylabel('away points')
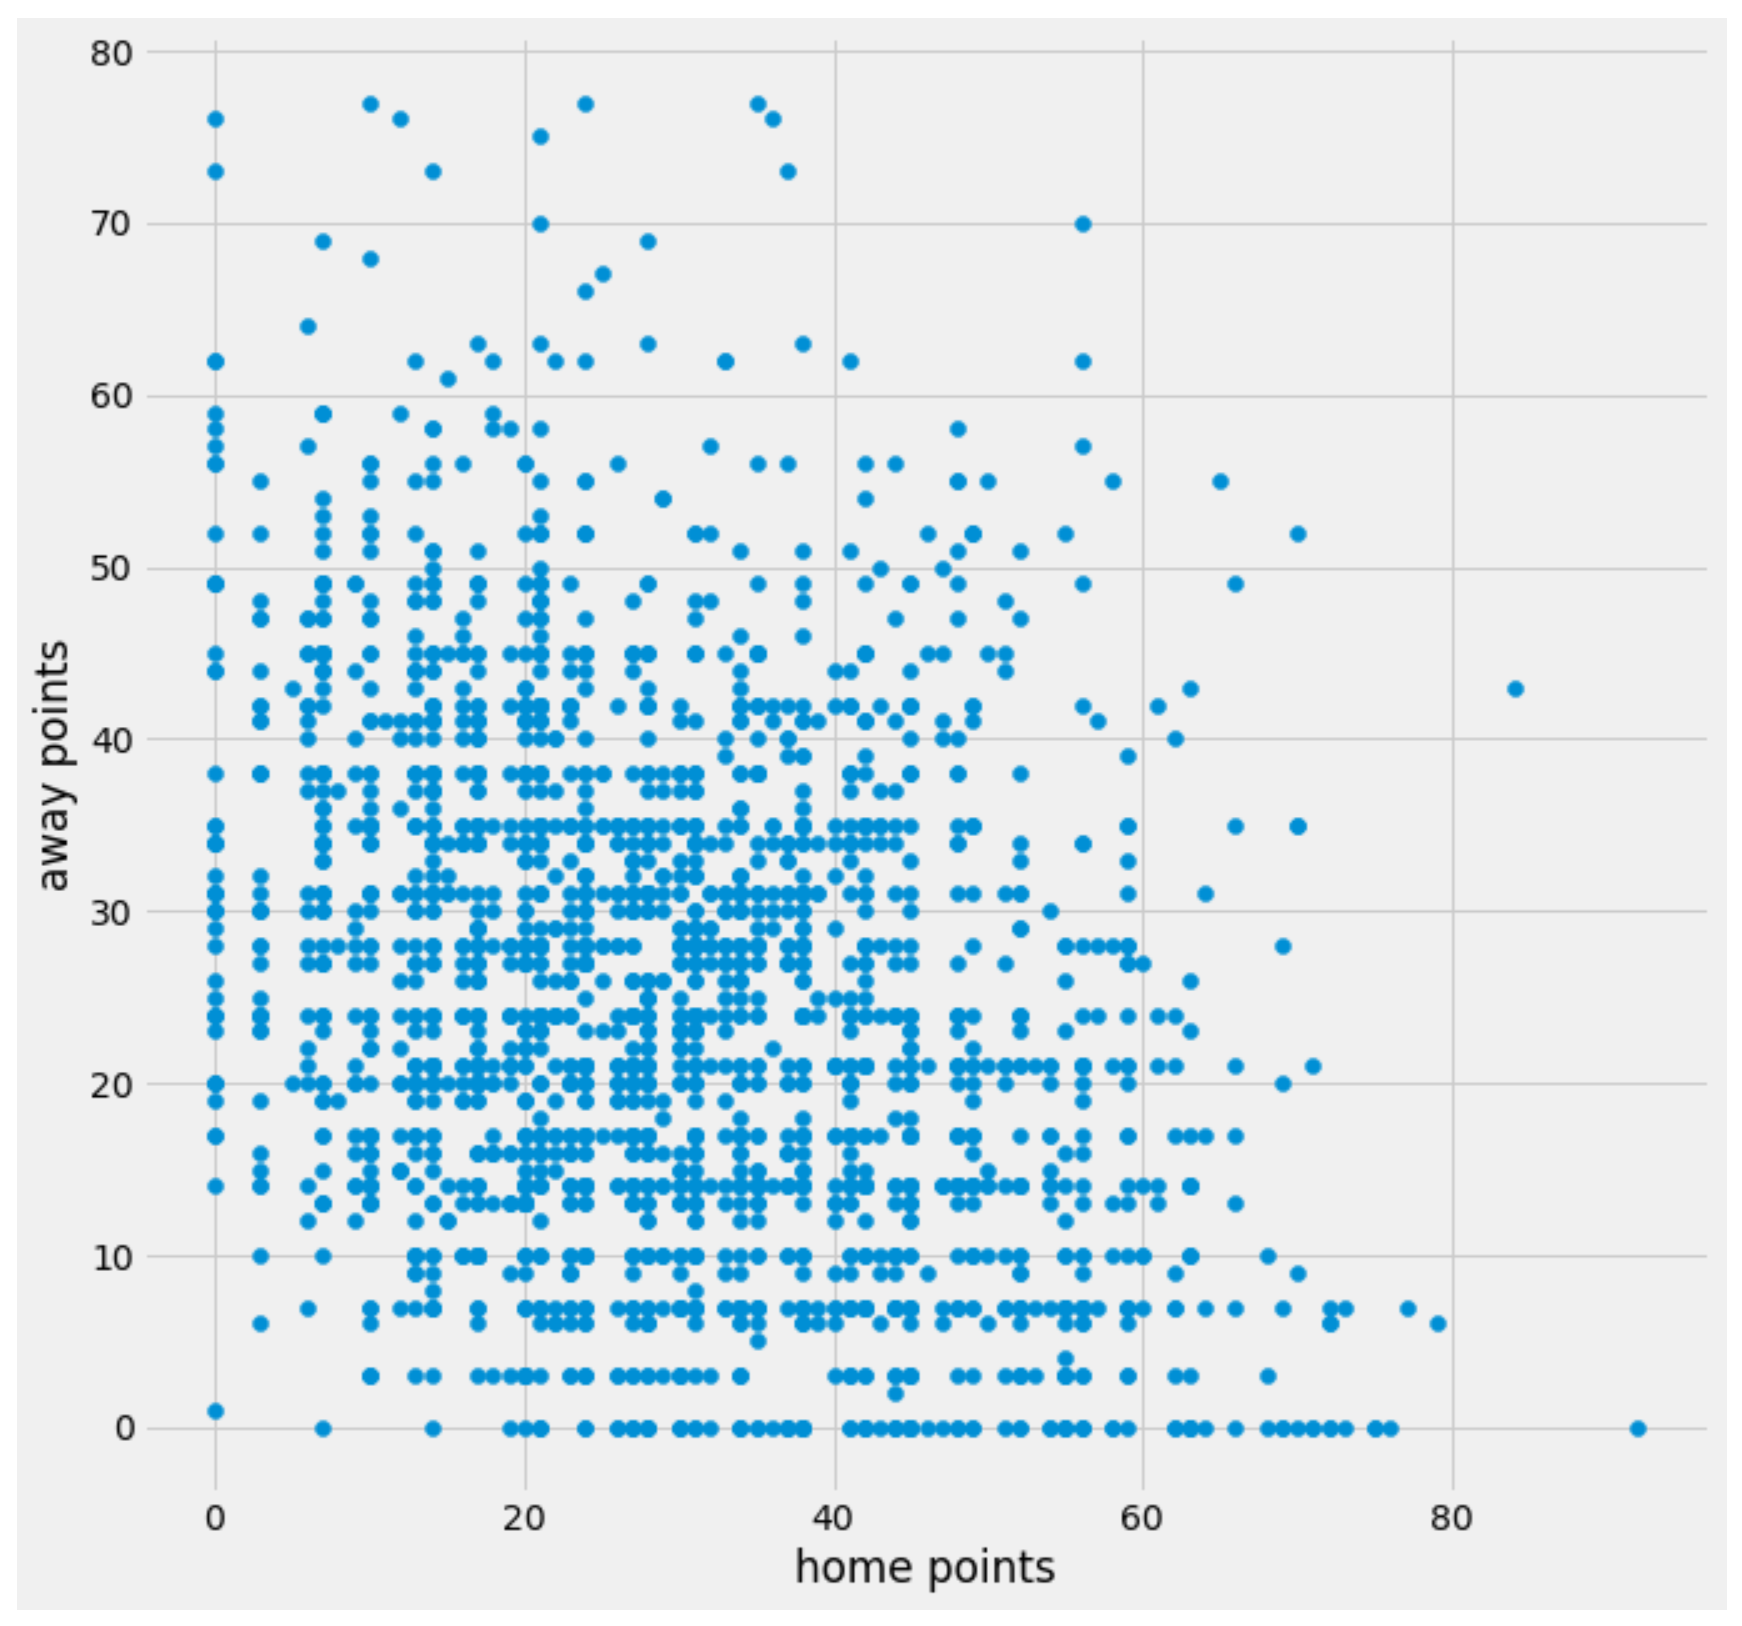
We can also add a custom style to make that look a little prettier.
import matplotlib.pyplot as plt

plt.style.use('fivethirtyeight')
plt.rcParams["figure.figsize"] = [10, 10]

plt.scatter(df['home_points'], df['away_points'])
plt.xlabel('home points')
plt.ylabel('away points')
And with that, you pretty much have everything in your toolbox to get up and running.
What Next?
There are several different ways you can go from here. If you want to go deeper into building out some awesome charts, then definitely check out matplotlib or Plotly. If you want to go deeper into model building, I cannot stress how awesome Kaggle's courses are and they will introduce you to some awesome libraries such as scikit-learn and XGBoost.
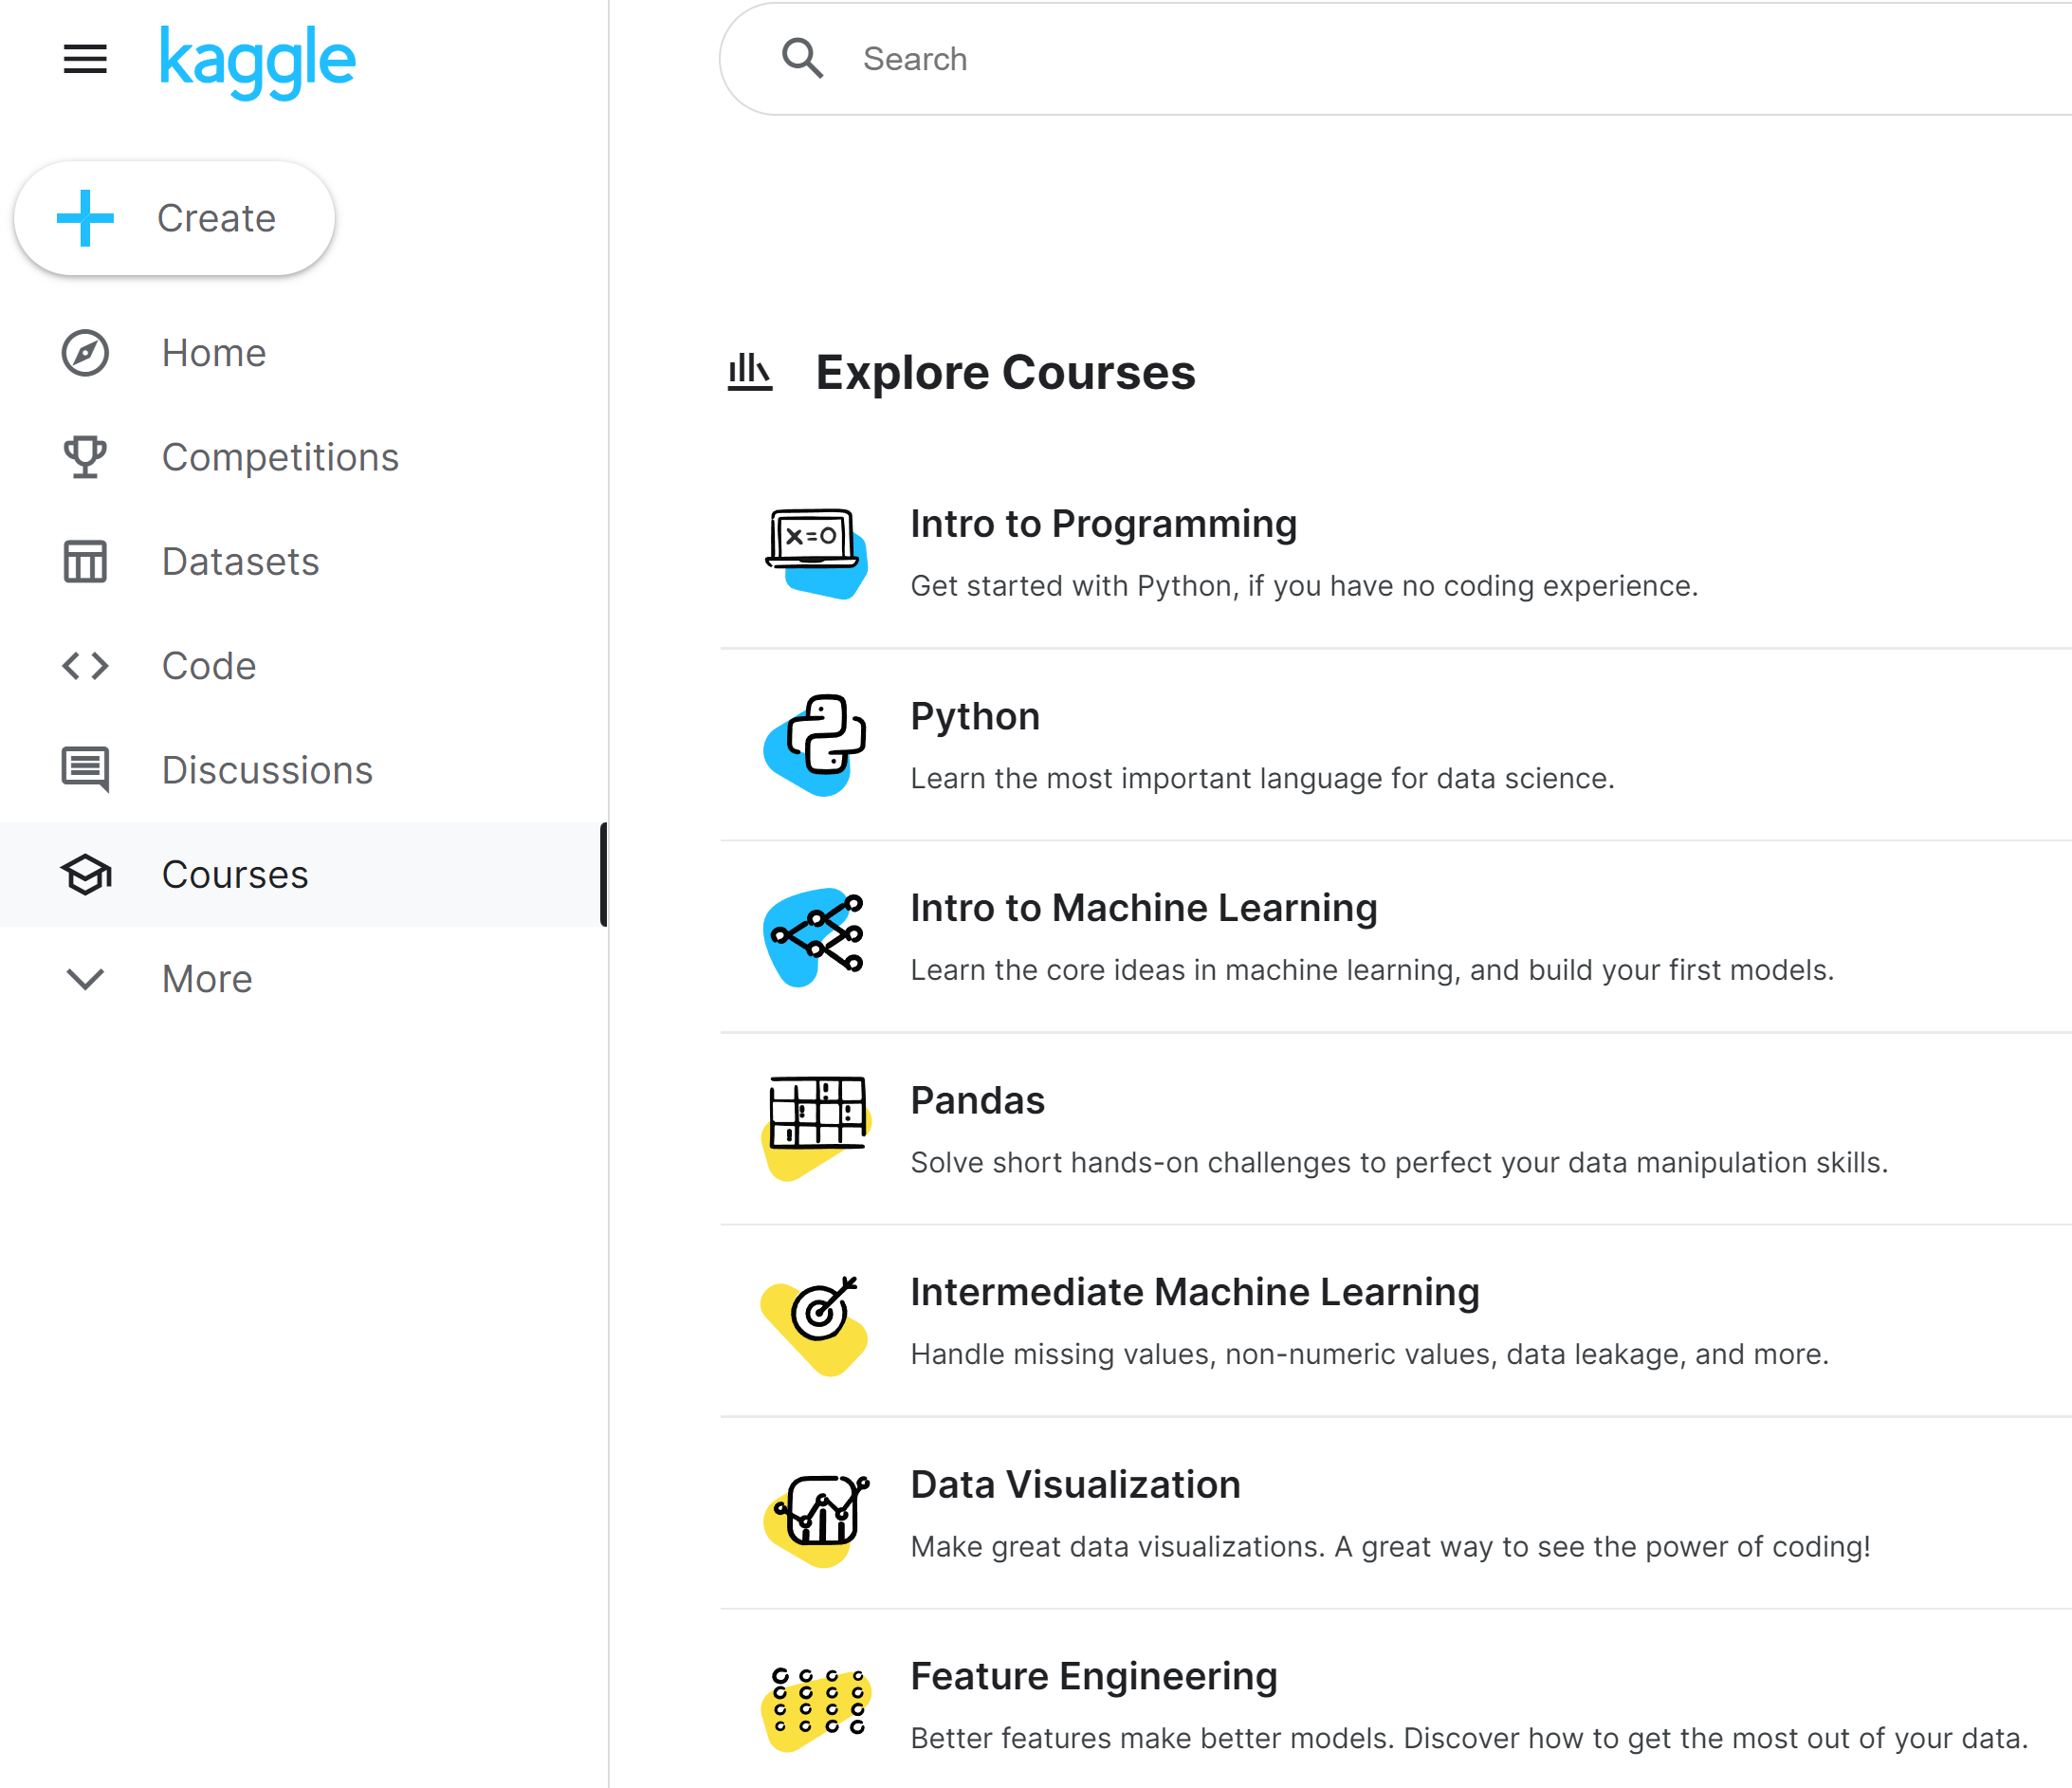
I personally recommend every course shown in the screenshot above. The best part is that they are all interactive and free!
There are also several tutorials and guides on this blog written by myself as well as by others that have more of a college football focus. Some that are good examples of using the above and other tools and libraries include:
- Creating Charts with Plotly (Note: Pre-dates API keys)
- Creating Elo Ratings for College Football
- Create Maps and Geo Charts
- Building and Artificial Neural Network to Predict Games
- Predicting Play Calls using a Random Forest Classifier (Note: Pre-dates the CFBD Python library and API keys)
And more posts will continue to be added over time from both myself and others on various subjects. Also be sure to read over the CFBD Python docs to see everything you are able to do with the Python library.
You now have all of the tools that you need to get started in CFB analytics. What path you choose next is largely up to you, but hopefully the above presents a good number of resources to help you continue down whatever path you choose. And just to reiterate, the sky is the limit! We get better as a community by sharing our work and propping others up. So if you build something that you're proud of, share it! We've got great communities on Twitter (@CFB_Data), Reddit (/r/CFBAnalysis), and Discord. These communities are enhanced when people share their work, both large and small, and most importantly, it helps us all to grow.
If you have any thoughts, please feel free to hit me up on Twitter (@CFB_Data), Discord (BlueSCar), or Reddit (u/BlueSCar). I always love seeing what people take away from these articles.