
Talking Tech: Calculating Elo Ratings for College Football

Back in the early days of this blog, we walked through the process of building a Simple Rating System to rank teams, also known as SRS. SRS has a lot of benefits, such as providing a good relativistic rating of teams since it is based purely on scoring margins. It also has some major drawbacks, which we discovered with the weird 2020 season. Namely, it relies on there being a decent number of cross-conference matchups so that it can properly gauge team strength. When teams are playing only in their own isolated conference pods, it makes the calculations weaker and sometimes even impossible to calculate.
One other drawback to SRS is that it's often not a reliable metric until late in the season. Elo ratings, on the other hand, can carry over from season to season and don't have these same drawbacks. Does Elo have other drawbacks? Sure. I wouldn't recommend using them to try to beat Vegas. What they do provide is a good grasp of relative team strength and trends over time. Before we go any further, it would probably be helpful to dive into what exactly Elo is.
What Exactly Is Elo?
Named for the Hungarian-American physicist and chess master who created them, Arpad Elo, the Elo rating system was initially devised as a way of calculating the relative skill level of two chess players. It was soon extended to other zero-sum games and team sports. If you're reading this, you're probably familiar with Jeff Sagarin of USA Today and his popular rating systems for football and other sports. For a number of years, one of his main systems was "Elo chess" and is perhaps the most prominent example of applying the Elo formula to American football. More recently, FiveThirtyEight have been pushing their own form of an Elo rating system for the NFL. So, what actually goes into an Elo calculation?
The basic idea of Elo is pretty simple. First, you need an initial rating to give to new players and teams. A common starting value is something like 1500, but this number can be anything based on how you want to scale your ratings. By going with an initial rating of 1500, we're basically saying that an average player or team would be expected to have that rating.
Next, we need to figure out how the ratings translate into expected outcomes. We're going to keep things super simple and stick to the base Elo examples found in the Wikipedia article. You can also check out a similar article from the Carnegie Melon Sports Analytics Workshop that focused on the NFL and uses the R programming language. I am not a huge fan of R, but if you prefer that language to Python then that latter article may be worth checking out for you.
Anyway, we're going to be using this pretty standard Elo formula from Wikipedia for calculating the expected outcome of a game given the Elo ratings of the participants. We won't dive too deep into the math, but this is a standard logistic curve function.

Let's break down what each of the parts represents:
- EA is the expected score for team or player A. For our purposes, expected score is synonymous with win probability.
- RA is the Elo rating for team or player A.
- RB is the Elo rating for team or player B.
- 400 is sort of an arbitrary value that determines the scaling of our ratings. This can be completely changed. With this value set to 400, a ratings difference of 400 points between two teams will give the favored team about 90% odds of winning.
Given two teams and their Elo ratings, I should be able to use the above formula to compute a team's odds of beating the other team. If both teams have the same rating, that formula will give an output of 0.5, or 50% win odds. Now this is all well and fine, but how do we use this formula to make adjustments to the ratings of the respective teams after a game has been played?
The Power of K
For each game that gets played, we are going to use the formula from the previous section to calculate the expected score (or win expectancy) of each team. We are then going to take the difference between each team's expected and actual scores and use those differences to make an adjustment to each respective team's Elo rating. What do I mean by actual score? Remember that the expected score is basically the win probability of a particular team, but games aren't graded on a percent scale. For each game, there are three possible outcomes: win, loss, tie. Yes, college football does not allow for ties, but ties were quite common not too far in the past and depending on how far back you go, they may factor into your calculation. We'll score game outcomes as follows: score of 1 for a win, 0.5 for a tie, and 0 for a loss.
We're going to find the difference between the expected and actual scores for each team. Then we're going to multiple these differences by a K factor. Whoa, what the heck is a K factor? It's basically the largest amount an Elo rating can change from a single game. The higher you set K, the more volatile the ratings become from game to game. The lower you set it, the less reactive ratings are to single game outcomes. For the rest of this post, we're going to be using a K factor of 25, which is a good, balanced value. Anyway, here is the formula for computing rating changes from a single game outcome.

Breaking down these symbols:
- R'A is the new rating for team A.
- RA is the current, pregame rating for team A.
- K is the K value, which we'll be setting to 25 for this guide.
- SA is the actual score for team A.
- EA is the expected score for team A.
And that's basically it. For the rest of this guide, we'll be digging into how to implement this in code, but first let's summarise the process.
- Each new team starts out with an Elo value of 1500. This is what we will consider to be an average score.
- Using a logistic curve function, we can find the expected score, or win probability, for each team in the game based on their respective Elo scores.
- Finding the difference between each team's expected and actual scores, we can multiply this value by an arbitrary K factor which will determine how high or low to adjusted each team's score based on the outcome of the game.
Hopefully, you've noticed some implications from this type of rating system. For one, larger upsets will result in a larger score increase for the winning team and a larger corresponding score decrease for the losing team. Also, a win by a heavy favorite results in less of a rating jump than a win over a more evenly matched opponent. Another great thing about Elo ratings is that they can carry over from season to season so, unlike SRS ratings, you don't need to wait until late in the season to have reliable ratings. The drawback to this, however, is that it adds an "inertia" effect from how well (or poorly) a team performed in prior seasons. Though another great thing about Elo ratings are that while each game a team plays has an impact on the team's rating, the effect of older games diminishes over time.
Hopefully, you can see some of the elegance in this type of system. Yes, there are some drawbacks as we just pointed out but there are things we can do to mitigate those drawbacks to an extent. For now, how about diving into some code?
Diving into Code
And now for the fun part. Let's go ahead and spin up your Python environment. If you don't have a Python environment, you can check out my previous post for how I set mine up using a prebuilt Docker image. If you are using my environment image, please note that the location of the image has now moved over to GitHub Package Manager due to DockerHub dropping support for their free tier of image hosting. One benefit of this change is that the image is now rebuilt more regularly, ensuring that it always has the latest version of Jupyter and any other package dependencies.
Assuming you have your Python environment spun up, let's go ahead and import any dependencies we will be needing.
import cfbd
import datetime
import numpy as np
import pandas as pd
Let's also configure the cfbd Python package with our API key. If you don't have an API key, make sure to register for a free key via the main website. Make sure to paste in your API key to the appropriate spot in the code block.
# configure API key
configuration = cfbd.Configuration()
configuration.api_key['Authorization'] = 'YOUR_API_KEY_HERE'
configuration.api_key_prefix['Authorization'] = 'Bearer'

# instantiate a games API instance
api_config = cfbd.ApiClient(configuration)
games_api = cfbd.GamesApi(cfbd.ApiClient(configuration))
Now let's start defining some functions. Remember the logistic curve function we talked about in the previous section? Go ahead and write that function in Python.
def get_expected_score(rating, opp_rating):
    exp = (opp_rating - rating) / 400
    return 1 / (1 + 10**exp)

Given the Elo rating of a team as well as its opponent, this function will calculate the team's probability of winning the matchup, or its expected score. We can test it out some.
print(get_expected_score(1500, 1500))
print(get_expected_score(1400, 1500))
print(get_expected_score(2000, 1500))
Fantastic. Remember, you can completely change the value of 400 if you want in the formula. Making it smaller will give you a smaller scale for your ratings while increasing that value will widen its scale. Feel free to play around with that as much as you want.
Since we have a function defined for calculating the expected score of a team, we should now be able to use that function to make adjustments to Elo score based on the outcome of a game. We're going to define another function that takes home team Elo rating, away team Elo rating, and final scoring margin as parameters and returns the new Elo ratings for the participants. This will look like below.
def get_new_elos(home_rating, away_rating, margin):
    k = 25

    # score of 0.5 for a tie
    home_score = 0.5
    if margin > 0:
        # score of 1 for a win
        home_score = 1
    elif margin < 0:
        #score of 0 for a loss
        home_score = 0

    # get expected home score
    expected_home_score = get_expected_score(home_rating, away_rating)
    # multiply difference of actual and expected score by k value and adjust home rating
    new_home_score = home_rating + k * (home_score - expected_home_score)

    # repeat these steps for the away team
    # away score is inverse of home score
    away_score = 1 - home_score
    expected_away_score = get_expected_score(away_rating, home_rating)
    new_away_score = away_rating + k * (away_score - expected_away_score)

    # return a tuple
    return (round(new_home_score), round(new_away_score))
Hopefully, that's easy enough to follow based on our Elo walkthrough from earlier. Again, we're merely finding the difference in actual and expected scores for each team, multiplying them by our predefined K factor of 25, and adding that adjustment to the pregame Elo scores. Finally, we returned a tuple of two values, the first being the new Elo rating for the home team and the second being that of the away team. I should probably also note that the margin value refers to the difference in home and away points (i.e. a positive value is a home win while a negative value is an away win).
We now have the meat of our Elo system in place. It's now just a matter of grabbing some game data and running these functions. Before we continue, I'd like to define two more helper functions which will come into play later on.
def date_sort(game):
    game_date = datetime.datetime.strptime(game['start_date'], "%Y-%m-%dT%H:%M:%S.000Z")
    return game_date

def elo_sort(team):
    return team['elo']
These will both be used to help us sort some lists. The first function takes a data string and converts it to a datetime object for sorting. The second just returns an Elo rating, which will again be used as a sort function.
Grabbing game scores from the CFBD API should be pretty straightforward using the cfbd Python package. We're going to get all games from the year 2000 on, but you can certainly go further back if you so desire. Heck, you could go as far back as 1869 (like the official CFBD Elo ratings do).
games = []

for year in range(2000, 2022):
    response = games_api.get_games(year=year)
    games = [*games, *response]

games = [dict(
            start_date=g.start_date,
            home_team=g.home_team,
            home_conference=g.home_conference,
            home_points=g.home_points,
            away_team=g.away_team,
            away_conference=g.away_conference,
            away_points=g.away_points
            ) for g in games if g.home_points is not None and g.away_points is not None]
games.sort(key=date_sort)
Notice that we used our date_sort function from above to sort our final data set. This is super important because we want to process rating changes in the order in which games were played. We also filtered out games without score data, games that have yet to be played in other words.
We can now loop through each game to calculate current Elo ratings for each team. We will also be tracking pregame and postgame Elo ratings for each game for each team so that we can track team trends over time as well as look at how game outcomes affect team ratings.
# dict object to hold current Elo rating for each team
teams = dict()

# loop through games in order
for game in games:

    # get current rating for home team
    if game['home_team'] in teams:
        home_elo = teams[game['home_team']]
    elif game['home_conference'] is not None:
        # if no rating, set initial rating to 1500 for FBS teams
        home_elo = 1500
    else:
        # otherwise, set initial rating to 1200 for non-FBS teams
        home_elo = 1200

    # get current rating for away team
    if game['away_team'] in teams:
        away_elo = teams[game['away_team']]
    elif game['away_conference'] is not None:
        # if no rating, set initial rating to 1500 for FBS teams
        away_elo = 1500
    else:
        # otherwise, set initial rating to 1200 for non-FBS teams
        away_elo = 1200

    # calculate score margin from game
    margin = game['home_points'] - game['away_points']

    # get new elo ratings
    new_elos = get_new_elos(home_elo, away_elo, margin)

    # set pregame elos on game dict
    game['pregame_home_elo'] = home_elo
    game['pregame_away_elo'] = away_elo

    # set postgame elos on game dict
    game['postgame_home_elo'] = new_elos[0]
    game['postgame_away_elo'] = new_elos[1]

    # set current elo values in teams dict
    teams[game['home_team']] = new_elos[0]
    teams[game['away_team']] = new_elos[1]
There are a few other assumptions that should be pointed out in the code above. We discussed setting initial ratings to 1500 for teams that are unrated. However, we are only going to do that for FBS teams. For non-FBS teams, we'll set an initial rating of 1200. Again, this is another variable you are free to change to your liking. We are denoting which teams are FBS by the presence of a conference label. CFBD currently only tracks conference information for FBS teams, so if a conference label is missing it's safe to assume that it is a non-FBS team. (This is very likely something that will change in the future.)
Okay, if you ran that above code snippet, we should now have some Elo ratings! Using one of our predefined sort functions above, I'm going to convert our team dict (which holds the current rating for each team) into a list ordered by rating from highest to lowest.
end_elos = [dict(team=key, elo=teams[key]) for key in teams]
end_elos.sort(key=elo_sort, reverse=True)

end_elos
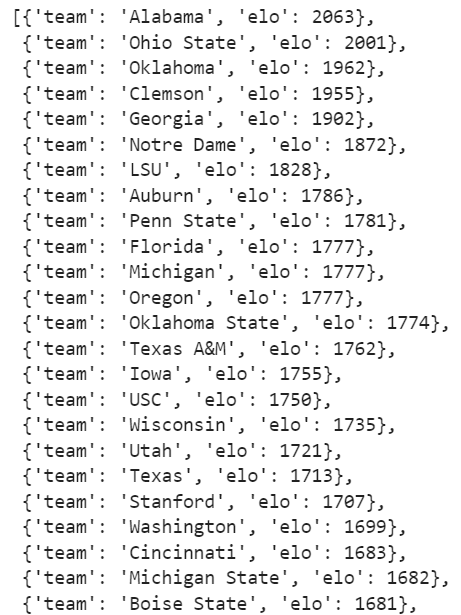
As of this writing, we are about 5 weeks into the 2022 season, so this list looks pretty legit! That said, you can definitely see how some teams' ratings are over- or under-inflated based on past seasons (looking at you Clemson). This goes back into one of the drawbacks of Elo being the "inertia" effect from prior seasons. Unlike an individual competition like chess or something like tennis, team sports have roster turnover from year to year. There are ways we can account for this to an extent. About which, more in a second.
It would be pretty cool if we could chart some of this data, wouldn't it?
Been making some major tweaks to the Elo calculations over the weekend to make things a little less "swingy" and I think they're just about ready for primetime.
— CollegeFootballData.com (@CFB_Data) October 3, 2021
Going to go through some regened charts (plus some new ones), starting again with Bama. pic.twitter.com/qlI0gwiC6p
We're going to be doing something similar to the above series of tweets, but using the ratings we just generated. Let's import and configure matplotlib so that we can generate some charts.
import matplotlib.pyplot as plt

# This is the styling I use. Check out other themes here: https://matplotlib.org/3.2.1/gallery/style_sheets/style_sheets_reference.html
plt.style.use('fivethirtyeight')

# Graph sizing
plt.rcParams["figure.figsize"] = [20,10]
The following function will, given a team name, use the collections of games we generated to grab all Elo ratings for that team on a game-by-game basis and generate a chart.
def generate_chart(team):
    team_games = []
    for game in games:
        if game['home_team'] == team:
            team_games.append(dict(start_date=game['start_date'], elo=game['postgame_home_elo']))

        if game['away_team'] == team:
            team_games.append(dict(start_date=game['start_date'], elo=game['postgame_away_elo']))

    df = pd.DataFrame.from_records(team_games)

    fig, ax = plt.subplots()
    ax.plot(df.index, df['elo'])

    ax.set(xlabel='Game No.', ylabel='Elo Rating',
           title="Historical Elo Rating - {0}".format(team))

    plt.show()
Let's test it out!
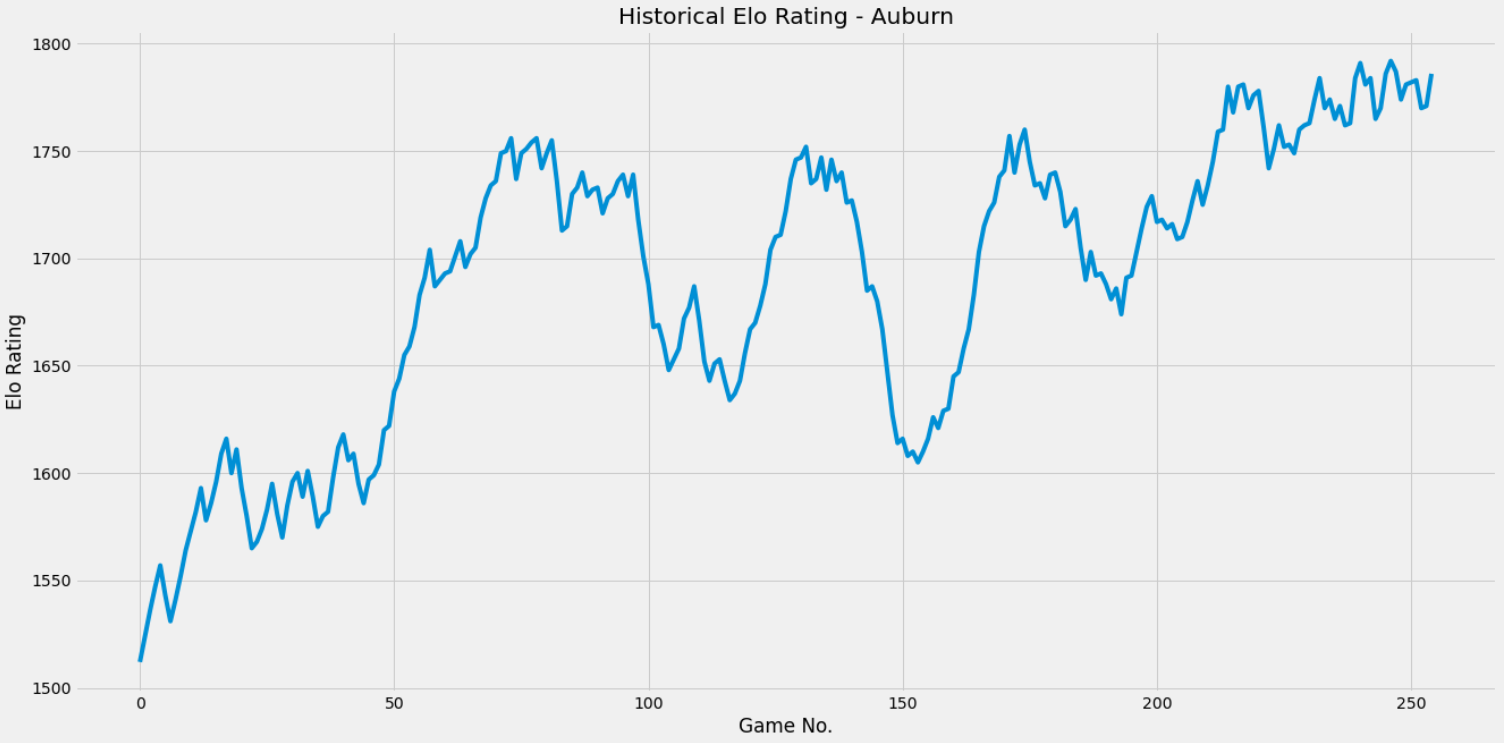
generate_chart('Auburn')
generate_chart('USC')
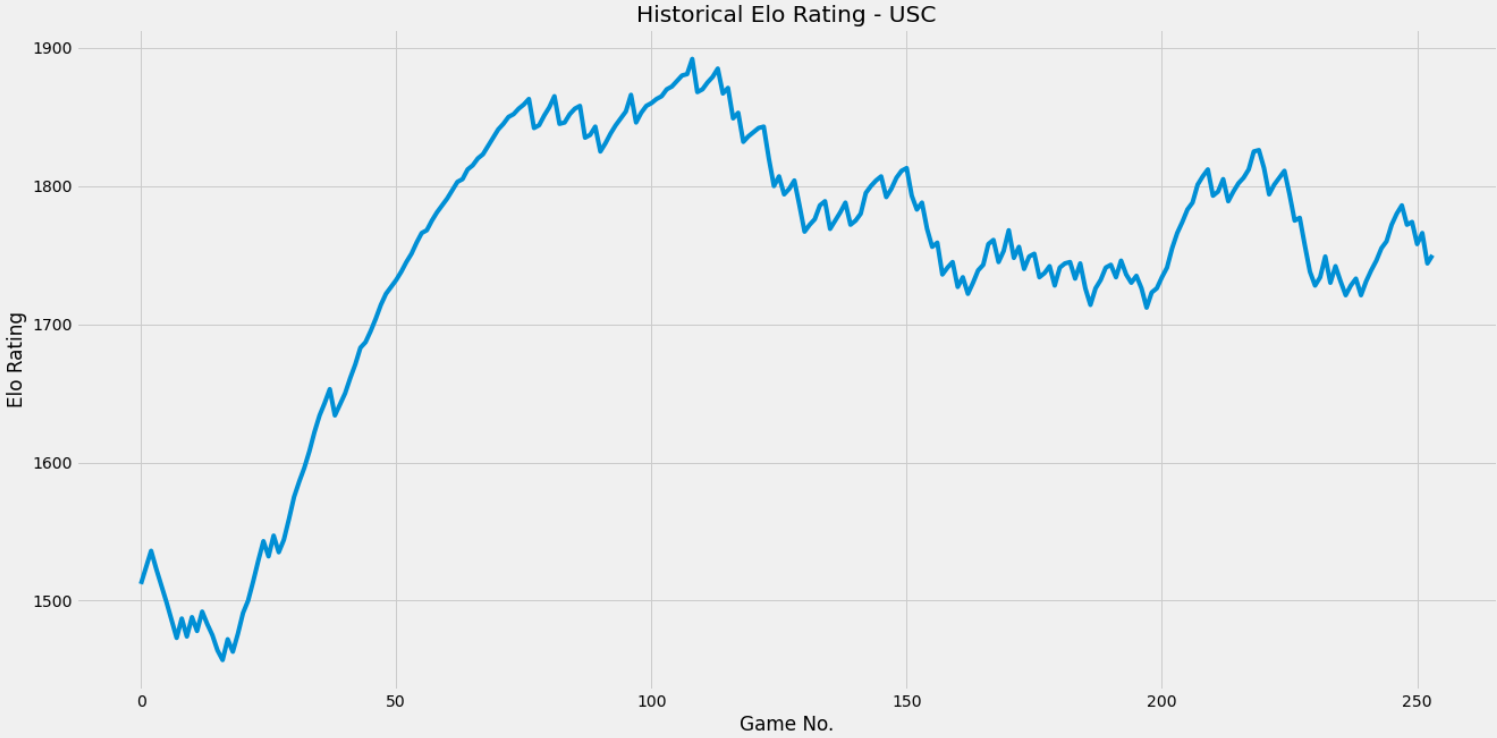
Pretty cool, huh?
Refining Our System
Congratulations on implementing your first set of Elo ratings! There are several things you can now do to refine it. One thing we talked about was reducing the inertia effect from previous seasons' successes and failures. Can you think of any adjustments we could make? One idea is to set a modifier to revert all team scores a certain percentage back towards the mean score of 1500 when each season turns over. This has the benefit of still maintaining some of the inertia. After all, rosters don't tend to turn over 100% from year to year in college football. So you'll probably want to carry over some of the results from the prior season, the question just is how much?
There are several other things you could potentially look at to strengthen these.
- We can make an adjustment to account for roster turnover from season-to-season, which we've already discussed.
- Can we make any adjustments based on home field advantage? Note that none of our formulas above do anything to account for this.
- Can we do anything with margin of victory? Right now, a 1-point victory is treated the same as a 50-point shellacking.
- We could go back and incorporate more games from further back to get a more complete history.
- Of course, we can make adjustments to the K value, the initial starting rating, and the value of 400 we used in the expected score function.
How to go about accounting for these various things, I will leave it to you to figure out should you wish to go deeper. You can find the Jupyter notebook I used for this post up on GitHub. If you want to check out the official CFBD Elo Ratings, these are also now available in the game data via both the website and API. Be sure to check them out and let me know what you think!